You are using an out of date browser. It may not display this or other websites correctly.
You should upgrade or use an alternative browser.
You should upgrade or use an alternative browser.
- Status
- Not open for further replies.
dbphoenix
Guest Author
- Messages
- 6,954
- Likes
- 1,266
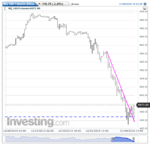
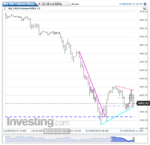
Also the level of the September high and the median of the Spring range.
Db
So The Money decided to support price here after all. 4430 to 4475, midpoint 4452, the September high and the median of the Spring range.
Db
(The chart below is the same as what I posted earlier only including the line I referred to above; I didn't add today's action to it.)
Attachments
Last edited:
dbphoenix
Guest Author
- Messages
- 6,954
- Likes
- 1,266
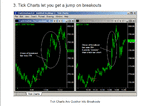
Somebody sent me an email asking my opinion on tick charts (the bundled kind) and a particular site that pushed them as being superior to other types of charts. It's just this sort of thing that bugs the hell out of me.
According to these people, the time bar is "slower" than the tick bar and thus the time trader is at a disadvantage because the "breakout" takes place so much later. But none of this has anything to do with bars or closes. Rather it has to do with change of stride and reversal. As I've shown with arrows, the SLA entry beats the hell out of either the "tick" chart or the time chart.
All one has to do is draw a straight line.
Db
Attachments
Gring0
Well-known member
- Messages
- 264
- Likes
- 128
Somebody sent me an email asking my opinion on tick charts (the bundled kind) and a particular site that pushed them as being superior to other types of charts. It's just this sort of thing that bugs the hell out of me.
According to these people, the time bar is "slower" than the tick bar and thus the time trader is at a disadvantage because the "breakout" takes place so much later. But none of this has anything to do with bars or closes. Rather it has to do with change of stride and reversal. As I've shown with arrows, the SLA entry beats the hell out of either the "tick" chart or the time chart.
All one has to do is draw a straight line.
Db
I am not so up to date with the ticks bundled, but I would think they'd be similar to volume bars we had used a long time ago. The message was still the same. It's the behaviour that determines whether demand or supply is in charge not bundling. The price level shown is same irrespective of which kind of bar interval it is.
I am having a tough time remembering why I also used to get confused about these things. The only thing I remember is just going through the price movements bar by bar (1 min) and then doing it the same on live or replay data. Then one day the bars fell off, even though I was still using them, and movement emerged. Admittedly I did have to ask questions when Db's illustrations wouldn't make sense to me as to how he saw the change in stride earlier.
Now, the process is streamlined. In those days Db was figuring it out how to teach this stuff to those who were interested and damaged. Could it be that not many want to just sit there and observe, for just the sake of observing?
In my opinion if one's bundling the tick, one can easily just use the 30 sec or a 1 min time bar interval and it wouldn't make too much of a difference. Price is king. Where it is and how it has behaved up to that point is all we can see in the present. It's from this we must deduce whether probabilities favour continuation, reversal, or trendless meandering.
Gringo
dbphoenix
Guest Author
- Messages
- 6,954
- Likes
- 1,266
In my opinion if one's bundling the tick, one can easily just use the 30 sec or a 1 min time bar interval and it wouldn't make too much of a difference. Price is king. Where it is and how it has behaved up to that point is all we can see in the present. It's from this we must deduce whether probabilities favour continuation, reversal, or trendless meandering.
Sounds familiar:
How are we to know in advance why and to what extent someone else is prompted to buy or sell? We cannot know; it is impossible for us to foretell what actuates all of those whose orders are poured into the vast intake of the Stock Exchange machinery during the day's session.
But if we study the action of prices; the responses; the speed of the ticker, indicating urgency or the contrary; the intensity of the buying or selling, as indicated by the volumes; and the intervals when the volume is heavy or light -- all these in relation to each other -- then we gain insight or the design and the purposes of those who are dominant in the market situation for the time being.
All the varying phases of market technique may thus be studied and interpreted from the buying and selling waves as they appear on the tape. From these we form a conclusion as to the balance of the probabilities. On this we base our commitments.
–Richard Wyckoff
I am not so up to date with the ticks bundled, but I would think they'd be similar to volume bars we had used a long time ago. The message was still the same. It's the behaviour that determines whether demand or supply is in charge not bundling. The price level shown is same irrespective of which kind of bar interval it is.
At one time, the Constant Volume Bars made sense because so little was going on overnight, and the CVBs made spotting the trends easier. But that hasn't been the case for quite some time. The Asian and European markets are very much important players today. Just look at these great moves that take place at 0400. For me, the CVB is and has been a fossil.
I am having a tough time remembering why I also used to get confused about these things. The only thing I remember is just going through the price movements bar by bar (1 min) and then doing it the same on live or replay data. Then one day the bars fell off, even though I was still using them, and movement emerged. Admittedly I did have to ask questions when Db's illustrations wouldn't make sense to me as to how he saw the change in stride earlier.
Once one understands that all charts are tick charts, a lot of stuff falls away. When I post my display, it isn't that all those intervals are important to me. I couldn't care less about whether the trades are displayed via 15m bars or 1m bars or whatever. I'm interested in what those who do care about all that are looking at, for it is they who move price, not the bar interval. Yesterday was a prime example given the importance of 4450. As long as one kept his eye on the same ball as the daily and weekly traders, which is after all where the market-moving money is, then he was okay.
Now, the process is streamlined. In those days Db was figuring it out how to teach this stuff to those who were interested and damaged. Could it be that not many want to just sit there and observe, for just the sake of observing?
That's part of it. The chief problem is that they are not there to do it; they're working. I don't like admitting how long it took me to pick up on this. But urging working people to focus on longer intervals, chiefly daily and hourly, didn't really fly because the longer intervals aren't "exciting". And I was surprised that some thought that observing tick charts was supposed to take place for weeks, when it really isn't necessary to do it for more than twenty minutes or so, at least so far as understanding the continuity of price.
But there is also more than one type of observation, and more than one objective that is reached by each type. There is, as mentioned, observing a tick chart in order to understand that price is continuous and the whole bar thing is nothing more than an invention. But there is also the observation that picks up on behavioral phenomena, such as changes in stride and higher lows and double tops and "support and resistance" (which I find is understood by almost nobody). This type of observation is addressed in the "Developing A Plan" section of the SLAB, but also here and there in Notes. But I've also added an update of the old "How To Do It" to Notes which can be found below. If and when one wants to go beyond all this and get to the work, then he has to begin the observations in earnest and make and maintain those notes which will enable him to make sense of all of it and use what he learns to make some serious money.
Db
Attachments
Gring0
Well-known member
- Messages
- 264
- Likes
- 128
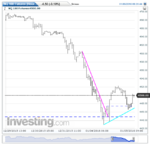
And we test the high of the pre-open range. LSL on the hourly is 25.
Db
Free points for those who saw the 4401 comment earlier. That's 20+ points in 10 mins.
dbphoenix
Guest Author
- Messages
- 6,954
- Likes
- 1,266
Whatever one does from this point forward for the day, this morning provided an object lesson in analysis, determination of danger points, and assessment of risk. Even if one missed 86, which I posted at 0836, price returned to 91 ten minutes later. What's the danger point? What's the risk? Is the trader willing to accept that risk? If he doesn't know any of this, I hope he's not trading.
Db
Db
MajorMagnuM
Legendary member
- Messages
- 9,284
- Likes
- 888
And he we are back at 4450. 64pts all told.
Db
just wanted to show this white pf
Last edited:
dbphoenix
Guest Author
- Messages
- 6,954
- Likes
- 1,266
just wanted to show this white pf
How is this pertinent to the SLA?
Db
MajorMagnuM
Legendary member
- Messages
- 9,284
- Likes
- 888
sorry Db it not. its only pertinent to the insturment you were discussing and thus i though it might have value as an added curiousity
dbphoenix
Guest Author
- Messages
- 6,954
- Likes
- 1,266
sorry Db it not. its only pertinent to the insturment you were discussing and thus i though it might have value as an added curiousity
Thank you, but if you've read the thread, particularly those posts relating to the timeframe you've selected, I'm sure you've noticed that too many lines generally lead to doubt and hesitation rather than confident trades and trade management.
Db
MajorMagnuM
Legendary member
- Messages
- 9,284
- Likes
- 888
Thank you, but if you've read the thread, particularly those posts relating to the timeframe you've selected, I'm sure you've noticed that too many lines generally lead to doubt and hesitation rather than confident trades and trade management.
Db
ive begun reading
- Status
- Not open for further replies.