SLAyers' Notes

Status
Not open for further replies.
This morning he'd see that price was passing through 30 at 0300NYT and testing it at 0645NYT. When the DL held, next up was 50. If one was watching price (and given the notice he had received or had found himself there was no reason he wouldn't have been watching price), he'd see price test 50, pull back to 39, then push toward 50 again, breaking through and working its way up to 4700.

To clarify, before I leave this:
 

Attachments

  • Image20.gif
    Image20.gif
    37.6 KB · Views: 181
This morning I was looking for a bounce off or breakdown through either the daily or weekly medians, which on my charts were within 20 pts of each other. Once price broke through the daily median, I started looking for a selling climax as laid out in DB's post #340 and in the book. It seems to have worked (even in real time). If I've done this correctly, maybe next time I will actually take the trade.

DB has been using 4490-4500 as a median recently, so I used that level as the bottom for my daily chart range.
 

Attachments

  • weekly 12-31.png
    weekly 12-31.png
    58.2 KB · Views: 142
  • daily 12-31.png
    daily 12-31.png
    41.5 KB · Views: 169
  • selling climax.png
    selling climax.png
    67.1 KB · Views: 141
Last edited:
This morning I was looking for a bounce off or breakdown through either the daily or weekly medians, which on my charts were within 20 pts of each other. Once price broke through the daily median, I started looking for a selling climax as laid out in DB's post #340 and in the book. It seems to have worked (even in real time). If I've done this correctly, maybe next time I will actually take the trade.

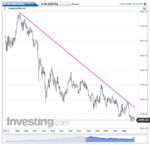
DB has been using 4990-4500 as a median recently, so I used that level as the bottom for my daily chart range.

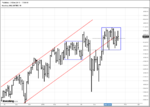
Not sure what you mean by your last sentence. I haven't been focused on a daily range at all but rather the hinge that was formed last week (post 364). The dynamics are different, thus what one looks for and waits for in terms of a trading opportunity is different. Then of course there's bar interval. If you're trading daily/hourly bars, then you'd have entered as illustrated in posts 365/66 and would have been fine until day before yesterday, at which point you would have exited the short, and you'd have then been looking for a long.

However, you're jumping here from a daily chart to a 1m, so I don't know what you're shooting for. I don't recommend becoming an instant daytrader. If your situation has changed and you can follow a 1m interval, that's a whole 'nother realm. If it hasn't, and you can't, then I suggest you pursue this out of intellectual curiosity and seek to apply whatever you learn to whatever bar interval you have the time and opportunity to trade.

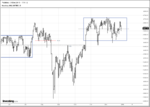
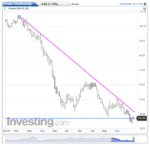
If you're trading hourlies, the only opportunity to go long after exiting the short would have been the evening of the 29th. It's not likely you would have taken it, but, if you had, you'd've been kicked out of it quickly and been in position to take the short yesterday morning, which is still in effect.

Point being to focus on what you're actually going to trade. The rest of it may be interesting in terms of learning how to track traders' behavior, but unless you can translate that into a practical application, it will be of little to no use to you.

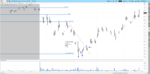
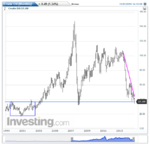
FWIW, tho, even though you missed the short at 0935, you pegged the reversal at 4600 and the entry at 1045. Eventually these protocols become automatic and require little thinking, which makes emotionless trading possible.

Db
 
Gold Weekly. Downtrend is still in effect as price is on the left side of the line. No breach yet. One day the courage of sellers may fail, but it is not this day.

Gringo
 

Attachments

  • Gold Weekly.png
    Gold Weekly.png
    31.1 KB · Views: 125
Last edited:
Gold Weekly. Downtrend is still in effect as price is on the left side of the line. No breach yet. One day the courage of sellers may fail, but it is not this day.

Gringo

Are we channeling Aragorn? :)

I don't know that courage is the chief concern, more that they're trying to find buyers, and buyers aren't yet willing to step up.

Db
 
Crude

Crude. Longer term. 30's are an interesting area of potential support. The trend is still down and until there are indications of some kind of demand it's something to admire from a distance for a buyer.

Gringo
 

Attachments

  • Crude Weekly.png
    Crude Weekly.png
    27.6 KB · Views: 201
  • Crude Monthly.png
    Crude Monthly.png
    28.3 KB · Views: 203
Is the hinge still relevant once you've broken out of it? I thought we were back in ranges on both daily and weekly, as shown in my charts. Believing so sent me back to your post of two weeks ago below. (Sorry, I meant 4490-4500 but typo-ed it originally.)

Originally Posted by dbphoenix View Post
Perhaps more than potentially. The mean of the channel I'm looking at is 4490-4500, and that appears to be good given this morning's activity. The November low is something that everyone is looking at.


I'm on vacation and watching price nearly round the clock, not actively trading, hoping to understand among other things volume and climaxes and learn how to apply them at tipping points regardless of interval. In terms of interval, I'm working toward trading the hourly, but in order to make lower-risk entries one drops down to a smaller interval, correct? The smaller the better, stealth entries, etc? Did I get that wrong?

Once I go back to work, I'm in a position to watch price intensley for a few hours each day, 0830 -1130 NY time. So the one minute (and even the 10 tick chart) is interesting to me both in terms of studying price behavior generally, but also, I thought, it would be practical and applicable in terms of entries cued by hourly breaks. ?
 
Take it one step at a time.


Behaviorally, why does the hinge form in the first place?

Behaviorally, what does a "break" out of a hinge signify?

Db

Buyers and sellers are struggling over price in a narrowing range.

One side gives up.

So therefore, when price re-enters the range, the battle resumes and yes it is still relevant.
 
Last edited:
Buyers and sellers are struggling over price in a narrowing range.

One side gives up.

So therefore, when your re-enter the range, the battle resumes and yes it is still relevant.

In so many words. The "struggle" in this case is a search for equilibrium (see Notes). Leaving the hinge represents a search for trades beyond the equilibrium level, and this will go on until sellers run out of buyers on the upside or sellers are no longer willing to lower their prices on the downside. In this case, traders explored the upside. This only went so far as the last swing high, which is why I mentioned it in post 379. Given that sellers ran out of buyers, the LOLR became down, most likely a return to the apex of the hinge, the equilibrium level, "value", and that's where we reversed this morning. It's not a "battle". There is no battle. It's just traders looking for trades, traders looking to conduct business.

Now, of what interest is any of this to someone who is trading daily/hourly bars?

Db
 
It points toward where and when price may move dramatically and allows the trader to prepare for the move, if it happens.

Not exactly. As I said in post 367, the trader who entered when he was supposed is not especially concerned about this until a higher low is made on the 21st. At this point, a hinge is forming, and there's the possibility that he's going to have to exit the trade which, as I said earlier, he would have to do on the 29th. I also said in post 368 that if he weren't in at all, this hinge and the activity surrounding it would most likely provide him with an entry point, which is what the posts since then have been about. Even so, playing it would not require going to anything less than an hourly. If you want to look at something smaller, such as a 30 or a 15, that's fine, though once you begin playing with a 15m interval, you're in daytrading territory and you may as well slip in with both feet. But this requires a different mindset, one which may screw you up when you have to go back to a larger interval.

All that aside, you may have figured out by now that the book requires study, not just reading. I must also reiterate that the principles matter more than the details. If, for example, you look for hinges in live trading that match the illustrations in the book, you're never going to make this work. The charts in the book are there solely to illustrate the principles. It's the principles that create the hinge and that tell you what to do in live trading. If you review "Trade the Behavior, Not the Pattern" in Notes and keep hinges in mind, this should become clearer.

The SLAyer who entered yesterday morning, according to the rules, is still short and none of today's jockeying nor the bounce off the apex of the hinge matter. The SLAyer who wasn't short, however, could still pick up a few points off that reversal, but he'd give up all the advantages of trading a larger bar interval.

Db
 
If value wasn't found above the hinge, traders might scout the lower side of the hinge in search of it. Demand at apex can also return, making reading price behavior more important for determining potential movement than price shapes and formations.

Today is a good example of hourly and smaller intervals suggesting opposite trades based on intervals. The hourly short from yesterday and the bounce off apex/median on smaller intervals today. This

Gringo
 
Last edited:
Might and often do, which gives these hinges a see-saw effect. Having scouted 80+pts above the apex, traders may well scout in the opposite direction. The ultimate direction will depend on what they find.

But, again, if one is already short, he becomes an observer.

Db
 
Given that the weekly hasn't changed to any pertinent degree and has served this week primarily to provide yet further confirmation of the value of AMT, I am instead posting a sort of "end-of-chapter quiz" so that those who are interested can engage in a "self-diagnostic" to determine whether or not their conceptual and perceptual frameworks (la-dee-da) are on the right track.

I've used numerals rather than geometry to peg "points of interest". This I hope will encourage side-door entry into the analysis and discourage attempts to look up matching illustrations in the book.

If the act of reading left to right has not yet become automatic, cover the chart just past whatever bar you're looking at. I've blown it up to make it easier to hide the numerals, but you can of course blow it up even further.
 

Attachments

  • quiz.gif
    quiz.gif
    85.4 KB · Views: 217
Last edited:
The beauty about price is that every change in direction leaves a clue behind. A clue that can be used to learn a bit more and get better. The above post is an example of so many movements and the prescription for each movement is different and based on one's bar interval and risk tolerance.

Gringo
 
I'm pretty weak at this but I'll give it a try.

1. Buyers briefly push price to new highs before price falls back closing near the low. Not enough buyers willing to pay what sellers were asking. Exhaustion/uptrust

2. Sellers tried pushing the ask up again toward new ground but not enough buyers willing.

3. Sellers then open the flood gates and pushes price down stopping near last swing low congestion area. Buyers come to support price.

4. One more weak try at pushing price into new territory but fail after 2 previous longs bars of pushing price down and back up. If buyers were gonna come in and push price to new high this would have been the time after the 2 day reversal.

5. Don't know the significance of 5. Looks like hidden strength closing in the middle but if there had been strength here price would have at least surpassed the previous 2 days highs.

6. Long down bar closing on the low. SOW.

7. Price failed to close above LSH closing on the low, another SOW.

8. Opens at low, closing near the high on a shortish bar, buyers in to support price at this level but not enough buyers to push price further. Not SOS, just support.

9. narrowest bar in the range, buyers and sellers finding value/equalibrium.

0. Long up bar, breaking away from equalibrium.

a. High of bar briefly breaks above the high at 7 but retreats

b. Closing near the high but at the high at 7. If strength was in the bar it should have surpassed the LSH.
 
1. Slight breach and failure to stay above resistance/previous swing high - possible range top
2. break of previous 10-day range bottom/support, 50% line between SH 1 and SL 3
3. LL
4. LH, failure to breach 1, LOLR down
5. HL following a LH, possible chop/range
6. LL made, downtrend resumption
7. LH, downtrend intact
8. HL, narrowing range, hinge formation
9. apex of hinge, price equilibrium
0. break of hinge SL
a. price hits century mark, tests LSH
b. closes below LSH, weakness
 
Status
Not open for further replies.
Top