Skim, what do you think of this?

stoploss please

Established member
Messages
780
Likes
10
Skim, what do you think of this

Hi Skim

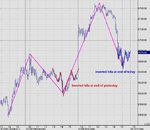
I know you do not use indicators and only look at price action. Today, I looked at the charts as you would, via price action and and also via my beloved RSI.

I always have problems with consolidations. I know that they should break in the direction of the trend but self doubt can be a pain.

I have attached two graphs. The first one is purley the indicator and how I use it. The RSI was shouting at me go long on the flag break

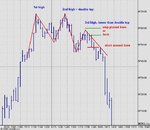
The second chart is purley price action. I understand your probable short entry at the top but which bar would you have hit on the flag break out.

Cheers
Andy
 

Attachments

  • dowchart1.xls
    47 KB · Views: 653
Perfect. Just one thing, I'd do away with the INDU volume..It does nothing for you... S&P futs VOL is a different matter.
Sorry, Skim, I didn't mean to butt in, just got carried away.
 
On your first chart, you will see a double top, and then a lower high - the break of this third top would be the ideal shorting place.

Once you see a lower low after the third high (actually it's the right shoulder of a head & shoulders), that is your short entry.

As Chartman says, don't bother with vol on the Dow - it is all the same height, and therefore meaningless (to me anyway). Use ES volume.

I find it easier to have all my bars the same colour - your eye is not distracted by the two colours and you can see the highs and lows easier.

On the Dow 5 min chart right now is an inverted head & shoulders being formed. I never want to be a 'told you so' but did you notice how well the inverted h&s worked at the end of yesterday that I annotated on the chart?

Now if you look on the big picture over the last couple of days, you will see an even bigger head & shoulders being formed. At the moment the right neckline is beneath the left neckline, therefore this is bearish.

So the inverted h&s at the end of today could just be the turning point for the right shoulder to form. But I try never to speculate, just trade what actually happens, when it happens, and not a moment before, or after - but it doesn't always happen like that!

Let me know if you don't understand, and I'll post a chart.
 
Yes, it's a lot of trouble, but as it's you asking, dear Options, I shall be delighted to rustle up a chart.

Just off to do some rustling ...
 
Skim

Thanks for this. You have got me thinking.

Chartman

I am now using channels on both price and the indicator. You are right about them being useful.

Can I just say that everyone on this site is Vhelpful.
 
Finished rustling, and the following two charts are my efforts.

First, the big picture, showing three different sets of head & shoulders, two of which are inverted. There are others, but it just got too confusing to show them all.

The inverted h&s at the end of today suggests that we may get an up move tomorrow morning, to form the right shoulder of the big picture h&s.

Dow chart, 5 minutes:
 

Attachments

  • dow 8 oct big picture.jpg
    dow 8 oct big picture.jpg
    57.8 KB · Views: 1,223
And now for the detailed small head & shoulders at the top of today's Dow.

You often get a h&s within a larger one, and they just unfold one by one.

The ideal short entry is just after the price has turned down after forming the 3rd hump, ie the right shoulder of the head & shoulders. At this position, you will know very soon if the trade is incorrect, and your stop will be hit. A very low risk trade.
 

Attachments

  • dow 8 oct.jpg
    dow 8 oct.jpg
    52.1 KB · Views: 1,113
And where else could you get an almost 10:1 R/R in a short space of time? Not that you knew it would go so low at the time.
 
The best place to short, of course, would be on the first lower low of the double top, assuming you were able to hold the trade going against you for the right shoulder formation.

The trough between the 2nd and 3rd peaks is lower than the trough between the 1st and 2nd peaks, so that would have given you a good idea that by then the market was bearish.
 
Skim

There is small peak in between 1 and 2. Has this any significance. The reason I ask this is because recently, I watched a documentary about giant waves. The ones you find in the sea and not on a chart. Apparently these waves appear out of nowhere to sink ships. The reason why they exist is because the killer wave takes energy from the waves either side of it.

Going back to the chart, immediatley after the first peak, we have a small wave up. The way I see it, the second top should be able to draw on the unused energy from new longs that was not spent used on the previous small peak. The inability of the second top break the high of the first top after a feeble middle peak also reinforced a bearish stance.

Does this make sense. I'm confusing myself now.
 
Skim - Where would you be taking your profit on the above trade?Would you take a fixed amount? or ratio to stop loss? or look for the opposite set up to your entry?
 
stoploss - difficult to say, especially as I don't trade the Dow intraday! However, another way of looking at that small peak is that it is a small head surrounded by large shoulders on either side - a hunchback h&s so to speak.

We had a good price rise up, therefore you would expect a period of sideways action while the bulls/bears decide who's going to win. Patterns take time to develop, and after that big run up you would expect a nice and clear pattern. The best patterns are the big picture ones, so if you get too bogged down with the little ones you will end up getting whiplashed.

What you say in your post is correct about the waves - they're so much easier to see and feel when you've been doing it for a few months, as you relax and 'see' them rather than 'think' them.
 
Lambchops:

On that particular trade it is easiest to leave your stops at the top of the previous bar, so you are just moving your stops down as the price goes down.

However, there was a ledge/shoulder formed in the early part of the day at around 9710 to 9720, so therefore you would expect a similar thing to happen on the way down. And of course 9700 is a psychological point too. You could decide to take your money then, or use the top stops to keep you in the trade.

At psychological points such as 9700, I keep an eye on the futures - if they're charging on down, then the Dow is going to carry on down as well.
 
Top