Simple MA strategy

Mackdaddy1988

Junior member
Messages
14
Likes
0
Hi guys,

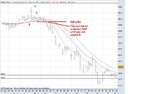
A simple strategy that I am sure has been mentioned somewhere on the forums before. Basically its looking at price crossing over a 60 SMA, buying when it closes over a rising SMA and selling when it closes under a falling SMA. Buying or selling can also be done when price closes over or under a flat SMA, but I believe this is a lower probability trade.


If the trade is successful as shown in the picture, then the trend can be ridden until it closes below the SMA, which will be at a higher point (when buying) or lower point (when selling) as the SMA follows the trend. Keeping a tight stop loss will ensure a good reward to risk ratio. Further confirmation can be obtained by using the cross over-pull back method, where price closes over or under the SMA, pullbacks, then continues in the trend direction. This strategy would be more successful in a trending market as opposed to a range trading market.


An example of a short trade that is set up nicely with price closing below a falling SMA. Take profit can be wherever but a good spot is where the price climbs back to the SMA, which is at a lower point then the original entry. Stop loss can be if the price climbs back above the SMA.

If you look at the charts this strategy isn't always going to be successful but with a large reward to risk ratio the successful trades should offset the small losses.


Here is an example where price has closed over a rising SMA indicating a buying opportunity, however price fell back below the SMA and continued to fall. A stop loss could be set below the SMA or better yet the pullback method can be used for confirmation as shown:


Price closed below a flat SMA, pulled back a little, then continued onwards on a downward trend giving us confirmation. This trade also involved the price touching the SMA in a number of spots, however not closing above it, which didn't confirm an exit point. Finally price closed above the SMA, which confirmed an exit point. The pullback method can be used also when deciding on an exit, as sometimes price will close above the SMA, but then on the next candle fall right back below it and continue on the trend.


Here is an example of price giving us some false signals. On the upward arrow a buy opportunity has presented itself, the SMA is flat, price has closed above the SMA, a pullback has occurred and price has continued upwards. However this is a false signal as represented by the downwards arrow where price closes back below the SMA. Here you would consider getting out of the trade. This would come with a loss of 30 pips or so. You would then consider getting into the trade short, as it trends down. The strategy may yield a number of trades that are false signals, however once a trend forms there can be great reward. Range markets will yield false signals, trends are your friend.


The arrows show price in a range giving a number of signals. When price crosses over further confirmation can be when price pulls back and continues above the cross over which doesn't happen in this case. However even if trades were entered, the trade could be exited when the next candle closes over the other side of the SMA. This would cause a loss, however the loss is small compared to a successful trade.
 
Like I said its not going to work all the time, there are a lot of false signals out there, but with a tight stop loss when a trade is successful it can offset the small losses.

Assuming you stop& reverse with each fresh signal, 3 smallish winners out of 16 signals isn't great
 
Assuming you stop& reverse with each fresh signal, 3 smallish winners out of 16 signals isn't great

If you only buy when price closes above a rising SMA and vise versa and wait for price to pull back and then continue upwards or downwards then you get less false signals. There would be other signals to give you confirmation and reduce the number of false signals. For example on the very first chart I put up I would wait for price to break above the previous 2 highs before I entered as it gives me more confirmation of an upward trend.
 
Trendfollowing by using the averages is a very effective way of trading. However, the exits need something else, otherwise you can lose a lot of gains. Probably, eyesighting a chart for over bought/sold points is as good as anything. Waiting for a price to move over an average before exiting can become a disappointing waste of time and money.

This is a similar idea to yours that I did, and kept, from last year. Almost, certainly, the averages are about 8,12 and 24, but I can't remember and the session will be a morning one. There was a pullback entry. I don't use this system all the time but, maybe, I should do. Threads like yours show the older guys, sometimes, that they have deviated a bit a bit from what they used to do and that, sometimes, what they did was more profitable.
 

Attachments

  • FT10M Sep17 2010.JPG
    FT10M Sep17 2010.JPG
    69.9 KB · Views: 384
Trendfollowing by using the averages is a very effective way of trading. However, the exits need something else, otherwise you can lose a lot of gains. Probably, eyesighting a chart for over bought/sold points is as good as anything. Waiting for a price to move over an average before exiting can become a disappointing waste of time and money.

This is a similar idea to yours that I did, and kept, from last year. Almost, certainly, the averages are about 8,12 and 24, but I can't remember and the session will be a morning one. There was a pullback entry. I don't use this system all the time but, maybe, I should do. Threads like yours show the older guys, sometimes, that they have deviated a bit a bit from what they used to do and that, sometimes, what they did was more profitable.

Your right waiting until price crosses back over the average to exit can sometimes lead to a loss of the gains made previously. The hard part is knowing when to exit, as exiting too early can lead to you missing out on a very good trend. Its up to a trader how much they are risking and what their profit objective is, but I would suggest closing out a large part of your position at a desired level, and keeping a small portion open to follow the trend and close out if it crosses back over.

I am a big believer in keeping things simple, and simple strategies I agree are a lot more effective.
 
EURUSD 4H chart; identify a trending market, plot 200 and 50 ema, when 50 is above 200 , wait for a close below the 200, then a close back above and enter on close, stop is below the most recent low, target is up to you, can get very good risk/reward.
 
EURUSD 4H chart; identify a trending market, plot 200 and 50 ema, when 50 is above 200 , wait for a close below the 200, then a close back above and enter on close, stop is below the most recent low, target is up to you, can get very good risk/reward.

You are getting me started! My wife will be in, in a minute. "It is Sunday, you know"
 
Ok mackdaddy, if this is a viable method can you show us a chart for the coming week that has an entry signal based on this system- ie. can you show us an entry looking ahead instead of with hindsight of a perfect chart?
 
Try it in a live market and see how you get on. After briefly seeing profit 5 times and then taking 5 losses, you'll bail early for the 6th which then shoots off. Repeat until account is empty.

I think the way to use crossovers is to watch the crossover, which gives you a direction to be trading, then wait for a retrace, before then opening a position once you have confirmation it is going to move in the intended direction. In other words, you're trading in the direction of a trend once the trend has established itself.
 
By all means use the upward crossover for the long entry but if that's your only signal, then waiting for the downwards crossover for the exit is guaranteed to empty your account through lack of profit target exits and false signals.
 
You cannot use xovers for exits, especially large ones,like 50 and 200 avs, which have a terrible wait for a reversal in which it might, also, go sideways for days. I don't have the patience for that!

Your skill in getting out while in profit, while taking as much as you can and without running into breakeven or loss, is what is going to make you not one of the 90%. Watching signals from averages will not do that. It might, as I think shadowninja suggests, help you into a trade, or add to one. Getting out you need something else. I use a lot of instinct. That's not very technical, I know, but most instinct comes from watching chart patterns form, a kind of uneasiness that Mr Market wants my money!

Anyone who has looked at my chart should , also, note that low timeframes and low averages have a lot of whipsaws to them. There is no free lunch! :D
 
With a working knowledge of the Elliott Wave Principle, you would have known that that move up was a wave 2 correction and avoided it!


Here is an example where price has closed over a rising SMA indicating a buying opportunity, however price fell back below the SMA and continued to fall. A stop loss could be set below the SMA or better yet the pullback method can be used for confirmation as shown:


Price closed below a flat SMA, pulled back a little, then continued onwards on a downward trend giving us confirmation. This trade also involved the price touching the SMA in a number of spots, however not closing above it, which didn't confirm an exit point. Finally price closed above the SMA, which confirmed an exit point. The pullback method can be used also when deciding on an exit, as sometimes price will close above the SMA, but then on the next candle fall right back below it and continue on the trend.
 
You cannot use xovers for exits, especially large ones,like 50 and 200 avs, which have a terrible wait for a reversal in which it might, also, go sideways for days. I don't have the patience for that!

Your skill in getting out while in profit, while taking as much as you can and without running into breakeven or loss, is what is going to make you not one of the 90%. Watching signals from averages will not do that. It might, as I think shadowninja suggests, help you into a trade, or add to one. Getting out you need something else. I use a lot of instinct. That's not very technical, I know, but most instinct comes from watching chart patterns form, a kind of uneasiness that Mr Market wants my money!

Anyone who has looked at my chart should , also, note that low timeframes and low averages have a lot of whipsaws to them. There is no free lunch! :D


For exit decisions I use Slow Stochastic + Fib + Pivot Points

Time frames key. But Fib retracements and Pivot Points will highlight where 'S&R lines should be drawn and watched imho.
 
Top