You are using an out of date browser. It may not display this or other websites correctly.
You should upgrade or use an alternative browser.
You should upgrade or use an alternative browser.
If you don't like my posts, then just let me know and I won't waste my time writing them, I have better things to do with my time.
Regards Seastian
Your time is indeed appreciated VSA.
Greatly appreciate your time and effort in sharing your knowledge VSAtrader, your analysis of market action on an intraday basis is invaluable in highlighting the manipulation of the markets by smart money.
I would ignore irrelevant and adverse comments of some who are not interested in this methodology. I have left price based indicators behind and so do not focus on any thread pertaining to that type of trading but do not enter in there and start claiming that all this is rubbish and would urge the same course of action for those who find price/volume relationship of no use in their trading. Nobody is forcing anybody to come on to this thread.
I would ignore irrelevant and adverse comments of some who are not interested in this methodology. I have left price based indicators behind and so do not focus on any thread pertaining to that type of trading but do not enter in there and start claiming that all this is rubbish and would urge the same course of action for those who find price/volume relationship of no use in their trading. Nobody is forcing anybody to come on to this thread.
VSATrader
Guest
- Messages
- 160
- Likes
- 26
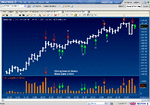
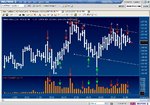
Intraday Analysis for ES Wednesday 28th Nov
Analysis for Wednesday 28th November 07
By Sebastian Manby
This analysis is for educational purposes only, I cannot be held responsible for you own trading. SFA rules prevent anyone in the UK from giving buy and sell signals on any charting program, or advice unless registered with the SFA. Even though they know SFA about trading.
A; Test of a previous shallow low in the background, the traders who matter knew that the data today would be soft, and I thought that the market would sell off on the news as prices were marked up, but there was little change.
B; This bar appears weak, because we have an up bar followed by a down bar. A true top reversal has a wide spread, and I this is clearly not a top reversal. The market easily absorbs this and continues upwards.
C; Supply is starting to swamp demand, we have an up bar closing off the high, and look at the volume, it is very high, it appears that liquidation has set in.
D; No Demand, this bar confirms that at this point the market is weak and you would expect a decline from here, but the previous 2 bars are not really showing much weakness, they are down on low volume.
E; Now we have a surprise, because we have weakness in the background, but here we have strength, so if we thought that the market was weak, we must now assume that the market cannot be that weak, else we would not have testing here. Shown by 2 green arrows.
F; Because of the strength shown at E, the market can rally to this point, but we have an up bar into point C, but with lower volume, but the volume is higher than the previous few bars, and the close is off the high, this is showing that supply is still around.
G; More testing, the weakness at point F was not strong enough to reverse the direction of the market, only enough to knock it sideways, giving bulls time to regroup and support the market. We now have a serious sign of strength, and if you were bearish before these green arrows, then you should not be now.
H; Another test in a rising market, this sign of strength is confirmation that the market is bullish and that you should follow the path of least resistance, up. Incidentally, this would be one of Tom’s favorite signals, and one he talks about in his book, The Undeclared Secrets.
I; Weakness has hit the market on the previous 2 bars, an this bar is weak as the high is higher than the high of the previous bar, you would now be looking for No demand to short or close out.
J; A test after weakness has appeared, this market is still strong, else it would not be tested like this after a sign of weakness has appeared.
The second red arrow after point I shows that the buyers and sellers are evenly matched here and indicates a possible turning point in the direction of the market. The second red arrow after point I is a bottom reversal, but the volume is quite high and could indicate a lower open Thursday.
Daily Chart;
I also predicted that the market would test the low of the 14th Nov, at 1470 low, the market has breached this today, and I am expecting the market to bounce lower, and possibly retest if it is still bullish on the daily chart at point A, if prices stay above this, then I expect point B to become resistance.
Attachments
Sebastian,
A couple of questions. Forgive me if they have already been answered in a previous post.
Why do you prefer 8 and 10 minute charts? Do you ever execute/manage a trade on lower time frames such as 1,3 or 5 minute? If not, why is this?
Also, Do you strictly trade the ES for Index trading? If so why not the ER2 or YM?
Thanks!
VSATrader
Guest
- Messages
- 160
- Likes
- 26
Reply to Mr Paul
Hi Mr Paul.
I use the 10m chart for analysis because it does not take me too long to cover by text, if I used a shorter time frame, I would not fit the chart in, and it would take me all night to write the commentry, plus it gives you a broad picture of what is happening.
The ES contract is the sun, and all the other contracts are planets rotating around the ES.
I now trade a 15m chart.
Regards Sebastian
Haha...Nice analogy. I see what you mean.
I ask because I used to trade very small time frames. I now see that the best rewards for you risk are on the 10,15 and 30 minute charts. I was curious to see if you thought the same
Thanks for your response 😀
dbphoenix
Guest Author
- Messages
- 6,954
- Likes
- 1,266
Hi Mr Paul.
I use the 10m chart for analysis because it does not take me too long to cover by text, if I used a shorter time frame, I would not fit the chart in, and it would take me all night to write the commentry, plus it gives you a broad picture of what is happening.
The ES contract is the sun, and all the other contracts are planets rotating around the ES.
I now trade a 15m chart.
Regards Sebastian
For the sake of an alternate perspective, I trade the NQ this way using a 1m chart. As long as supply and demand are components of what you trade, it really doesn't matter what it is or what bar interval you choose.
Db
If you don't like my posts, then just let me know and I won't waste my time writing them, I have better things to do with my time.
Regards Seastian
I appreciate your posts very much. I very much appreciate db phoenix being here too!. Both of you are PV experts IMO. I haven't been here because for some reason I am no longer get notifications to me e-mail on new posts? I just was looking for some of DB's posts and I saw replies on this thread. I thought it had died. I have a question for both Sebastian and db please. I have a hard time telling when the market makes a higher low on low volume if it's going to stop or go back and retest the low of the day? I read db's posts on pullbacks on low volume can show the original move up, for instance, will continue on. I am hope I am drawing a good mental picture, market stair steps higher or lower how to tell if those higher or lower swings will hold? If you would like me to post a chart I will. I feel very comfortable with shorting and vice versa double tops or bottoms on lower volume. It's easy money and a beautiful thing! 😆
I just realized after I re-read Sebastian's post above it addressed my issue of pullbacks on light volume in a rising market. If there is anything else that I should be aware I would appreciate the guidance.
Last edited:
Mr. Paul if I could chime in. I look at the 10 on the ER2 to get the roap map and then, at this point, scalp on the 1 or 2 min chart in the same direction the 10 is showing me. I hope this suggestion, for some, won't be hijacking or out of place. Any Carlsen taught me a very effective confirming technique for VSA using the MACD. Sometimes it easy to see the divergence on the MACD and then confirm it on the volume, since I only have 1 month of VSA study under my belt. The settings are 4,5, and 13 with exp. mov. avg. When you get a divergence set up on MACD and VSA it's very high prob. I believe Andy just scalps with VSA. Hopefully, I will get future notifications. 🙄
P.S. The reason I drill down to a much faster time frame is I can manage to get smaller stop. Some of the stop for VSA signals on a 10 min are more than 3 pts. in the ES.
P.S. The reason I drill down to a much faster time frame is I can manage to get smaller stop. Some of the stop for VSA signals on a 10 min are more than 3 pts. in the ES.
Last edited:
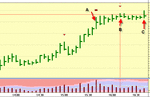
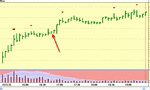
Wonder if you can help out here with VSA reading
In the attached chart the market has risen over 100pts , this is a TG chart with VSA indicators,
Now At "A", we have an upbar closing near middle on high vol, VSA signal indicates hidden selling.
At "B" the indicator lights up a No Demand bar.
and at "C", there is the upthrust
All the elements appear to be in place, a substantial rise, hidden selling, no demand, sideways move indicating distribution and finally an "Upthrust",
Question: Where and when if at all would one consider going short. and what would negate that ?
Attachments
dbphoenix
Guest Author
- Messages
- 6,954
- Likes
- 1,266
I appreciate your posts very much. I very much appreciate db phoenix being here too!. Both of you are PV experts IMO. I haven't been here because for some reason I am no longer get notifications to me e-mail on new posts? I just was looking for some of DB's posts and I saw replies on this thread. I thought it had died. I have a question for both Sebastian and db please. I have a hard time telling when the market makes a higher low on low volume if it's going to stop or go back and retest the low of the day? I read db's posts on pullbacks on low volume can show the original move up, for instance, will continue on. I am hope I am drawing a good mental picture, market stair steps higher or lower how to tell if those higher or lower swings will hold? If you would like me to post a chart I will. I feel very comfortable with shorting and vice versa double tops or bottoms on lower volume. It's easy money and a beautiful thing! 😆
I just realized after I re-read Sebastian's post above it addressed my issue of pullbacks on light volume in a rising market. If there is anything else that I should be aware I would appreciate the guidance.
These charts and the annotations which Mr Manby is providing are an invaluable resource to anyone wanting to understand PV analysis (I've always called this "PV analysis" though I continue to do so in order to distinguish it from "VSA", which has become almost a trademark for what Manby is doing, and I don't want to give the impression that I am in any way as expert as he is in its application). I used to provide this sort of exercise to my group, partly to force them to focus on the bars and partly to get them in the habit of reading a chart from left to right, which in turn would help them prepare for real-time trading (now that replay is available, the problem of working in hindsight in order to learn these principles is not so much of a problem any longer).
However, once one gets to the application stage, particularly if he is now comfortable with the application, the fevered urge to analyze every flow and eddy may pass and he is satisfied with his chunk, leaving all this behind to do something else with the rest of his day.
For example, I entered very early yesterday. Given the extent of the overnight action and the move all the way to R, I fully expected the market to backtrack and at least drifit sideways. However, when the market tested the opening low with little selling interest, I went long instead. After that, I exited when price approached R again and ran out of steam. The move was substantial and quick and easy and I was satisfied. I chose not to hang around for hours trying to eke out a few extra points (I've learned that after the first ninety minutes to two hours, traders tend to think more and get cute; this makes for a lot of back and fill, requiring wider stops, and I'd rather not get involved). One can, however, if he sees real potential for continuation, sell only part of what he has and leave the rest till the end of the day (this assumes that he's going to be somewhere else). If he's trading only one contract, however, best to TTMR in order to gain confidence.
All of which is to say that if you've reached your target (i.e., a reversal signal) and price makes a higher low on low volume, it may make no difference to you depending on your goals. A more important issue may be deciding what you want from the day.
Db
VSATrader
Guest
- Messages
- 160
- Likes
- 26
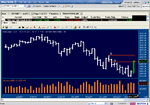
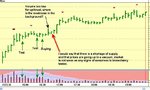
ES Analysis for 29th Nov 07
By Sebastian Manby
This analysis is for educational purposes only, I cannot be held responsible for you own trading. SFA rules prevent anyone in the UK from giving buy and sell signals on any charting program, or advice unless registered with the SFA. Even though they know SFA about trading.
A; Wide spread up with next bar down is a top reversal, and this is bearish. The first red arrow is no demand, market is weak at this point.
B; Tom would call this a hidden test, but it is the opposite of an hidden upthrust, with a low lower than the low of the previous bar, and the close on the high, this is bullish, and we are now looking for a test of strength.
C; A test, the market is challenging the bears to show their hand, and they don’t, volume relatively low and the market takes off.
D; This bar shows some weakness, it is also into the zone of point A, and this is why we are seeing this weakness, there is an old top to the left, and this is having an effect on prices.
E; The market is strong enough to push higher and through the old top at A, liquidation between 1470 and 1476 in now in play, the shorts around point A at these levels are probably having to cover their shorts, giving the smart traders the liquidity to short sell, we know this because the volume is ultra high.
F; No demand, and with weakness now in the background, there is only one direction the market can take, and that is down the toilet.
G; A second and more obvious no demand up bar here, if you look at the volume, it is really low. The market cannot rally as it is too weak, so a no demand up bar in a declining market is a golden opportunity in a weak market.
H; the close on this bar is equal to the open, this shows that buyers are returning to the market, enough to allow this to happen, at this point I would be looking for a sign of strength to close out a short.
I; A selling climax, a wide spread down, closing way off the low on ultra high volume is a sign of strength, thee professionals are active, they are closing out their shorts, and getting bullish, if this were not true, then the close would be near the low and prices would continue lower, instead prices have reversed, so as we continue to observe time after time, strength always appears on down bars, and weakness on up bars, hopefully you will have grasped this by now.
J; An average up bar, with an increase in volume, closing off the high means that the rally is stalling, the market could becoming bearish and we are looking for confirmation of this.
K; No demand, the rally is in trouble here, and we are near a top channel of a trend line, and with an old top at point E & F, that old top will hold for now. The next few bars are a mish mash of whipsawing.
Outlook:
I Think it is difficult to get a handel on which direction for Friday, but in a down trend I would expect the market to retest the low at 1463 possibly in the Asian session. Friday we have personal income and outlays at 13:30 GMT, I don’t know if this number is significant, but if Friday is up, then today’s action is a test, and I would expect a rally into next week, Friday will be a better day for me to predict the future.
Attachments
VSATrader
Guest
- Messages
- 160
- Likes
- 26
Wonder if you can help out here with VSA reading
In the attached chart the market has risen over 100pts , this is a TG chart with VSA indicators,
Now At "A", we have an upbar closing near middle on high vol, VSA signal indicates hidden selling.
At "B" the indicator lights up a No Demand bar. Can short on this indicator, but look for signs of strength as a danger.
and at "C", there is the upthrust See below
All the elements appear to be in place, a substantial rise, hidden selling, no demand, sideways move indicating distribution and finally an "Upthrust",
Question: Where and when if at all would one consider going short. and what would negate that ?
After an upthrust, it would be safer to short, and if you have the software, then you'll have the book too, and you will know that an upthrust is a stop catching tack tic so once you see this, it's quite safe most of the time, just watch out for sudden testing with in the next few bars, there should be no demand to follow.
Hope this answers your question.
Regards Sebastian
timsk
Legendary member
- Messages
- 8,912
- Likes
- 3,629
Hi Sebastian,. . . so as we continue to observe time after time, strength always appears on down bars, and weakness on up bars, hopefully you will have grasped this by now.
I've been enjoying your thread and wanted, albeit belatedly, to add my voice of support for your efforts - well done and thank you! My price and volume analysis skills are akin to my abilities to speak Spanish: fine for ordering a meal in a restaurant, but I couldn't hold a 'proper' conversation for love nor money. As such, I tend to rely on simple - easy to spot and grasp concepts - such as the one quoted. Much of the time though, PV analysis strikes me as being a rather nebulous art, so all credit to you, dbp and anyone else who manages to practice it with the skills demonstrated in this thread. Occasionally, you throw a complete 'curve ball' which totally throws me, this being a a case in point:
C; A test, the market is challenging the bears to show their hand, and they don’t, volume relatively low and the market takes off.
Suffice to say, I would have interpreted this bar as being bearish! Would you care to expand on your thoughts about it please?
Cheers,
Tim.
Hope this answers your question.
Regards Sebastian
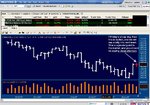
Thanks Sebastian,
Yes I have read about upthrust , a classic manoeuvre by smart money to catch stops, this time however the bulls won, I suppose there was the overriding strength from players on higher timeframe.
As can be observed from the chart, the market ignored all signs of weakness on the day.
Would greatly appreciate if you could comment on the next two bars following the upthrust, would presume they would provide that necesssary info on what action to take after the upthrust, afterthat the market shoots up by which time it will be too late unless ofcourse a buy stop was place above the upthrust.
Attachments
VSATrader
Guest
- Messages
- 160
- Likes
- 26
Hi Sebastian,
Occasionally, you throw a complete 'curve ball' which totally throws me, this being a a case in point:
C; A test, the market is challenging the bears to show their hand, and they don’t, volume relatively low and the market takes off.
Suffice to say, I would have interpreted this bar as being bearish! Would you care to expand on your thoughts about it please?
What I mean is, when I say this is, on a test, prices are forced down to encourage any seller to show their hand, if no such sellers short sell or longs closing out positions, then we see a low volume down bar, this is bullish, not bearish, this is why the market takes off, there is not enough sellers to lower prices. This happens only when the market is strong. there is a glowing explanation by Richard Wyckoff in one of his books, in which he is in the office of James R Keene, and someone bursts in the office and tells Keene about a stock, Keene immediately calls his broker and sells 30k stock short, the market absorbs this order straight away, this tells Keene that the market is strong, so he places an order to buy the same stock but 60k shares, this is the same principle on a test, the professionals will short sell a block, if there is no response, the professionals will know that the market is strong and buy back any shorts and that buying will mark the market up.
Cheers,
Tim.
Hi Tim;
Any down bar on low volume is a potential sign of strength.
Regards Sebastian
VSATrader
Guest
- Messages
- 160
- Likes
- 26
Thanks Sebastian,
Yes I have read about upthrust , a classic manoeuvre by smart money to catch stops, this time however the bulls won, I suppose there was the overriding strength from players on higher timeframe.
As can be observed from the chart, the market ignored all signs of weakness on the day.
Would greatly appreciate if you could comment on the next two bars following the upthrust, would presume they would provide that necesssary info on what action to take after the upthrust, afterthat the market shoots up by which time it will be too late unless ofcourse a buy stop was place above the upthrust.
Hi Joey;
Text is on the chart. You are focusing on the weakness which is countermanded by strong bars following weak bars.
Regards Sebastian
Attachments
dbphoenix
Guest Author
- Messages
- 6,954
- Likes
- 1,266
Any down bar on low volume is a potential sign of strength.
Regards Sebastian
It's what I call The Dog That Didn't Bark. You expect price to continue to fall. It doesn't. Why? Not enough seller interest. And if sellers aren't interested, buyers will have a much easier time advancing price (which helps to account for those troublesome price-rises-on-low-volume). If there's insufficient buyer interest as well, price will simply drift sideways.
If one sees only bars/candles, he will likely have more difficulty understanding this than one who sees trader behavior and considers trader motives. Trading is, after all, continuous, and the market couldn't care less how the trader chooses to display the transactions.
Db
Similar threads
- Replies
- 2
- Views
- 3K
- Replies
- 7
- Views
- 5K
- Replies
- 0
- Views
- 8K