hwsteele
Experienced member
- Messages
- 1,227
- Likes
- 182
Apologies folks for not getting a write up out over the weekend - had lots of family stuff going on.
Family stuff!?
Turning your back on trading for family?
well
I will take 1364 for next Friday.
Apologies folks for not getting a write up out over the weekend - had lots of family stuff going on.
I don't know about you folks
So congratulations to Pat's complex and simple algorithms for nailing the top 2 stops and to
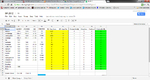
Link to results
Results for this week, might even get a write up done tomorrow!!
https://docs.google.com/spreadsheet/ccc?key=0AnFF2Rblu36wdGRNQjNXTzVjdldJb2dXdjRVTGs5VVE&pli=1#gid=0
Oh my gosh, I won!
Drinks for everyone!:drunk:
Now lets see if I can do it again.
1335 for next Friday.
Congratulations to the other two winners, oh wait, one other winner and to the square in the spread sheet that calculates😱nline2lo the average that came in second.
Well i keep looking at it and changing my mind so here it is for next week 1344 now i can get on and get some work done.
I see pat's gone higher.will it be raspberries and cream on the beach next weekend i wonder.