kimo'sabby
Experienced member
- Messages
- 1,622
- Likes
- 287
Spirit of Jazz
Old Gregg
Can watch these 2 endlessly. I really mean endlessly. Comedy genius IMO.
Brilliant!
Spirit of Jazz
Old Gregg
Can watch these 2 endlessly. I really mean endlessly. Comedy genius IMO.
Splashy,
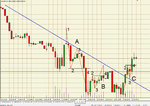
Very interesting to see a different kind of technique, I remember reading about it a while back. The thing I like about it is that its simple and systematic and your results speak for themselves. The problem I always had with it is knowing whats a 1 and what's a 2, etc. For example, on your FTSE chart, why doesn't point B then become a 1? Or does it have to be a swing low in this case depending on the trend line or something?
There are no predetermined directions which i guess is why it is useful as a reversal strategy. I find it just as fruitful trading pullbacks in a steady trend.
No ma's or indicators...the patterns tell me which direction to trade in by virtue of making higher highs/higher lows for long trades, and lower highs/lower lows for shorts. The high by 'B' in the chart that you mentioned would originally have been a potential 1 in a short pattern. (If you look carefully in the chart you'll see a faint blue line leading from the point where i was provisionally drawing in the first line of the pattern). Then point 2 and point 3 manifested and then...no point 4 or trigger so the pattern to go short wasn't completed. Meanwhile the pattern to go long was brewing and was completed so there was the trade even though i didn't take it.
I see the point in the method though, trying to catch some pips in the middle of trend (put very simply)
yep, by virtue of the characteristic that it waits for confirmation of the trigger at pt 4, the extremes of the trend/range don't get traded although it can pick up a reversal quite quickly.
The swing high on the dax that went above 6490.7 that got heavily rejected would have been my kind of trade, what a beauty.
Hi guys, let me clog up your thread...
I love simple methods like this. They always seem to hold up much better than overtly complex ones, probably because they reflect an underlying consistent behaviour in the market.
Couple of questions:
1) Do you notice that the best trades correlate to certain times of day (8:30 to 10:00, 14:30 to 15:30) for example?
2) I was surprised the draw-down wasn't as big - do you think this is down to trade selection and knowing that your 2xrisk has been pinged/traded through (and likely to be re-tested)?
Did you ever have discretionary elements in your trading Splashy?

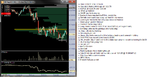
 12_07_2012 1.jpg")
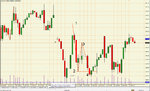
 12_07_2012 2.jpg")


Tough day - 1 scratch & 1 trade where I quit down 1 tick for 5 contracts.
Going to call it a day, I can't scalp these ranges - been too much going on with Missys 30th Bday this week & I can't focus as I need to.
Party tomorrow night... :clap:
 12_07_2012 1.jpg")
 12_07_2012 2.jpg")
 12_07_2012 3.jpg")
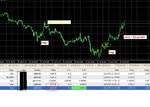
 12_07_2012 4.jpg")
2 sp500 trades today for +7 points or so (70 pips)
statement + chart attached.
I like days like these