robster970
Guest Author
- Messages
- 4,567
- Likes
- 1,390
To carry on from last night, I'll try and explain why I get in and out the way I do rather than scale out.
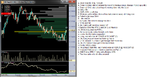
Basically I am looking for a trading opportunity at an extreme of a range, where price has largely mean reverted back to a value somewhere in between the 2 extremes. I use the overnight range as my markers.
This is all well and good providing you can guarantee that price will mean revert but quite a lot of the time, it won't do it right on the nose of the entry price you have in mind and occasionally it has no intention of mean reverting at all.
So I typically get in when I get confirmation of some weakness in and around this extreme. If it is too far away, either side of this extreme, I don't play.
As a consequence of getting in, I am usually either (i) right and it will mean revert with some gusto or (ii) I am actually fading a 2pt ES auction rotation and it will come back at me fairly shortly.
As I am in, I generally look for signs that I am the wrong side of the rotation and any whiff gets me out. This might be over-sensitivity but it works for me. As my entry is generally about 4 ticks in, I have 4 ticks to play with. Scaling out whilst trading like this would quite seriously damage my average r:r - remember my average r:r is about 0.65 and I need a high hit rate so scaling out whilst relying upon this dynamic would fundamentally alter the way I trade in a way I do not feel comfortable adjusting to.
 12_07_2012 1.jpg")
 12_07_2012 2.jpg")
 12_07_2012 1.jpg")
 12_07_2012 2.jpg")