Pat494
Legendary member
- Messages
- 14,614
- Likes
- 1,588
Me too
Closed for 1 point profit.
Me too
Trying a short@ 1282.1
Stop 1287.3
Limit 1273.
Might be wrong but 1273 target looks a bit ambitious ?
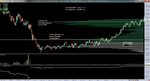
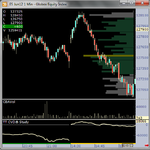
Firstly and most interestingly you'll notice from the RTH open, price was in discovery mode and was moving down, looking for buyers to come in. It eventually found them at the Low Value Area (1). The Low Value Node/Area is an area of low traded volume. It is a low volume area because people did not want to trade at that price. For the area highlighted, sellers thought this was too low. Guess what happens? The price is then rejected and then it starts to move up again.
Price then rises for a bit until sellers come back in again. It then starts to sell-off and this time ploughs through the LVN (2). LVN's due to their low traded volume are easy to plough through. Think about it, nobody is there to trade at that price and so you usually get a long bar when these kind of levels break. This move eventually exhausts and then price starts to rise again.
I understand your reasoning but let me play devils advocate in the analysis leading up. Yes, there was little volume traded the last time price hit this level. It was rejected and bounced. However, the market was supported here and sellers decided it was too low. Why would you expect it to plow through next time? Why do sellers now think that price is not too low when earlier they did?
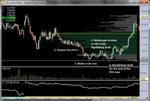
What a lot of people focus on when reading tape/DOM is on nailing point "D" and entering a trade there. It certainly is possible to catch a reversal point like that (esp if it's a reversal from a pullback) but don't make that all you look for.
If you focus on nailing "D" all the while, you may well find you keep jumping in front of Selling Pressure.
...
So - if you go by that alone, you are going to go through a lot of pain in the learning process.
A->C - When a market is putting in a sustained move, it has a certain appearance on your tools. In this case it's a down move and we'd define that 'appearance'/behaviour as Selling Pressure. So, with all your charts switched off, spend some time focused on the DOM & learn to recognise those A->C moves.
Sometimes, you see a market moving down and down and down and down and all the time you have your finger hovered over the buy button waiting for the opportunity to go long. I can tell you I spent a lot of time doing this through extended down moves. The thing is, if you see this type of action - SHORT IT. Don't sit there for 20 minutes watching the market going down waiting for a long opportunity.
So we have enough sellers around to hit ONL (proved) but not enough buyers around to push to ON-High...........
Where is the bias then? Who's got the greater weight of opinion, the buyers or sellers?
thanks as usual DT, this will give me more to think about when looking at the depth+sales
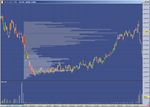
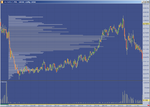
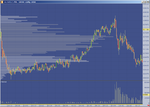
This is what I've tried to do
and this has been the results 🙂
Yeah, since I'm looking for D-types, I'm always looking to fade instead of ride the move. Again its tough to determine in real time. What do you look for to show you an A-C type move? I am thinking consistent, 1500 prints through prices.
Like on the D+S, when its not the open or close, I would say 500 contracts on average will cause a tick change. When I see sustained 1000+ on multiple levels as price continues to move down, then I know that selling pressure is coming in.


I'm trying to get clarity here cause in real time I have a lot of difficulty.
.........
I can easily determine the PAST bias, but find it hard to determine FUTURE bias.
Newbie Question 🙂 - Someone got a link to daytrading stocks here on trade2 win or is it mostly FX
It's in it's over lunch flat patch. But will shortly awake with some action ( when the liquid refreshments have worn off a bit - as it used to after a session in Dirty Dicks ).
Action stations