You are using an out of date browser. It may not display this or other websites correctly.
You should upgrade or use an alternative browser.
You should upgrade or use an alternative browser.
S&P 500 & other indexes - intraday. Plus chat
- Thread starter robster970
- Start date
- Watchers 52
Pat494
Legendary member
- Messages
- 14,614
- Likes
- 1,588
Pat, what figures do you use to set up your MACD oscillator, are they the same at any time frame?
Hi dp,
I use 12 14 14 and yes I use them always as I hope to get more and more used to this set of figures. I try to reduce the number of variables to as few as possible to make it easier.
Hope this helps.
Unless I find better ones
Last edited:
robster970
Guest Author
- Messages
- 4,567
- Likes
- 1,390
Can you guys please critique this trade?
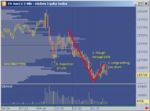
I can tell you what I see. It might be useful, it might not. Annotated below is your 5min screenshot with some points from me.
Firstly and most interestingly you'll notice from the RTH open, price was in discovery mode and was moving down, looking for buyers to come in. It eventually found them at the Low Value Area (1). The Low Value Node/Area is an area of low traded volume. It is a low volume area because people did not want to trade at that price. For the area highlighted, sellers thought this was too low. Guess what happens? The price is then rejected and then it starts to move up again.
Price then rises for a bit until sellers come back in again. It then starts to sell-off and this time ploughs through the LVN (2). LVN's due to their low traded volume are easy to plough through. Think about it, nobody is there to trade at that price and so you usually get a long bar when these kind of levels break. This move eventually exhausts and then price starts to rise again.
Finally price returns to the LVN. All those people who went long at the LVN now get the chance to get out at breakeven (3). This causes more selling, more people hop on the 'pullback' and momentum is created. The shorts ride it out.
On a general note, those that trade off charts alone will not be able to see that this Support/Resistance/Pullback is caused by a lack of liquidity at 1269 area. To trade LVN's consistently well you need to see volume and the order book IMO.
Keep trading like that and you'll be giving me and Pat critiques shortly 😀
Attachments
Pat494
Legendary member
- Messages
- 14,614
- Likes
- 1,588
12:30am AUD Cash Rate 3.50% 3.50% 3.75%
12:30am AUD RBA Rate Statement
All Day GBP Bank Holiday
3:45am EUR Italian Services PMI 42.8 41.8 42.3
4:00am EUR Final Services PMI 46.7 46.5 46.5
5:00am EUR Retail Sales m/m -1.0% -0.1% 0.3%
6:00am EUR German Factory Orders m/m -1.9% -1.0% 3.2%
All Day ALL G7 Meetings
8:30am CAD Building Permits m/m -0.3% 4.7%
9:00am CAD BOC Rate Statement
9:00am CAD Overnight Rate 1.00% 1.00%
10:00am USD ISM Non-Manufacturing PMI 53.6 53.5
7:01pm GBP BRC Shop Price Index y/y 1.3%
9:30pm AUD GDP q/q 0.5% 0.4%
DionysusToast
Legendary member
- Messages
- 5,965
- Likes
- 1,501
Can you guys please critique this trade?
I don't know much about market profile/volume profile, but I decided to give it a shot. Two screenshots are attached both giving my reasonings for getting in the trade, forgive me if this seems basic, I'm a newb.
I'm no expert in using the profiles either but I do think it is the way to catch longer term moves....
I think the method of finding balance and then fading the market when it gets out of balance is a valid technique and something you should persevere with.
Anyway - regarding the Tape/DOM on these trades. This is something I've been meaning to put up for a while and I'll put an abridged version here and do the full thing later.

This is a representation of a swing. Market moves down, market moves up.
What a lot of people focus on when reading tape/DOM is on nailing point "D" and entering a trade there. It certainly is possible to catch a reversal point like that (esp if it's a reversal from a pullback) but don't make that all you look for.
A->C - When a market is putting in a sustained move, it has a certain appearance on your tools. In this case it's a down move and we'd define that 'appearance'/behaviour as Selling Pressure. If you focus on nailing "D" all the while, you may well find you keep jumping in front of Selling Pressure. So, with all your charts switched off, spend some time focused on the DOM & learn to recognise those A->C moves.
Sometimes, you see a market moving down and down and down and down and all the time you have your finger hovered over the buy button waiting for the opportunity to go long. I can tell you I spent a lot of time doing this through extended down moves. The thing is, if you see this type of action - SHORT IT. Don't sit there for 20 minutes watching the market going down waiting for a long opportunity.
You'll only be able to short these fairly easy to take opportunities if you look for the buying/selling pressure and go with it. You need to train your eyes to see it and see it early.
D - Point "D" is usually either someone holding the market, absorbing the sell market orders hitting the bid OR it's shrinking balls on behalf of the sellers - they simply stop selling there. The problem with "D" is that the absorbing and shrinking balls happens a lot on the way down. So - if you go by that alone, you are going to go through a lot of pain in the learning process. That sort of trade needs 1 or 2 other reasons to take it in my opinion (such as it being the end of a measured move).
E - A lot of people call this entry a non-optimal entry. The people that harp on about Wholesale vs Retail prices would say it's crap because you are paying retail prices. Well fnck them. If you think about it - you should already know what you are going to see at point E. You'll have seen the "hold" at point "D" but right now it's probably best to pass those by and wait till you see buyers jump in and push price up AFTER the hold. You have 2 signs off the DOM then - the hold and subsequent buying pressure.
So - how will you know buyers have jumped in? How will you know it's real buying pressure this time? Well - you'll never know for certain but I'm pretty sure your ability to spot A-C type moves will come in handy. In effect, you give up a few ticks for confirmation.
All of this will fit in around your volume profile method. It's just suggestions on how to refine the entry.
I think you have my Skype id - feel free to hook up for a chat.
Pat494
Legendary member
- Messages
- 14,614
- Likes
- 1,588
I'm no expert in using the profiles either but I do think it is the way to catch longer term moves....
I think the method of finding balance and then fading the market when it gets out of balance is a valid technique and something you should persevere with.
Anyway - regarding the Tape/DOM on these trades. This is something I've been meaning to put up for a while and I'll put an abridged version here and do the full thing later.
This is a representation of a swing. Market moves down, market moves up.
What a lot of people focus on when reading tape/DOM is on nailing point "D" and entering a trade there. It certainly is possible to catch a reversal point like that (esp if it's a reversal from a pullback) but don't make that all you look for.
A->C - When a market is putting in a sustained move, it has a certain appearance on your tools. In this case it's a down move and we'd define that 'appearance'/behaviour as Selling Pressure. If you focus on nailing "D" all the while, you may well find you keep jumping in front of Selling Pressure. So, with all your charts switched off, spend some time focused on the DOM & learn to recognise those A->C moves.
Sometimes, you see a market moving down and down and down and down and all the time you have your finger hovered over the buy button waiting for the opportunity to go long. I can tell you I spent a lot of time doing this through extended down moves. The thing is, if you see this type of action - SHORT IT. Don't sit there for 20 minutes watching the market going down waiting for a long opportunity.
You'll only be able to short these fairly easy to take opportunities if you look for the buying/selling pressure and go with it. You need to train your eyes to see it and see it early.
D - Point "D" is usually either someone holding the market, absorbing the sell market orders hitting the bid OR it's shrinking balls on behalf of the sellers - they simply stop selling there. The problem with "D" is that the absorbing and shrinking balls happens a lot on the way down. So - if you go by that alone, you are going to go through a lot of pain in the learning process. That sort of trade needs 1 or 2 other reasons to take it in my opinion (such as it being the end of a measured move).
E - A lot of people call this entry a non-optimal entry. The people that harp on about Wholesale vs Retail prices would say it's crap because you are paying retail prices. Well fnck them. If you think about it - you should already know what you are going to see at point E. You'll have seen the "hold" at point "D" but right now it's probably best to pass those by and wait till you see buyers jump in and push price up AFTER the hold. You have 2 signs off the DOM then - the hold and subsequent buying pressure.
So - how will you know buyers have jumped in? How will you know it's real buying pressure this time? Well - you'll never know for certain but I'm pretty sure your ability to spot A-C type moves will come in handy. In effect, you give up a few ticks for confirmation.
All of this will fit in around your volume profile method. It's just suggestions on how to refine the entry.
I think you have my Skype id - feel free to hook up for a chat.
Quality stuff DT as usual
Pat494
Legendary member
- Messages
- 14,614
- Likes
- 1,588
Morning all.
No trades yet today tempted to go long es with stop just under 1269 where we made a double bottom but not sure it has the energy for much of a rise may wait for the main session today.
I've got it pencilled in for a small rise today and not much in the diary.
DionysusToast
Legendary member
- Messages
- 5,965
- Likes
- 1,501
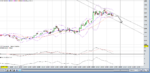
Todays study of where we are:
Asia Up
ES overnight well down, Europe Mixed
Interesting day – it seems that we are balancing around 1262-1282 with Value @ 1281-1271.
LVNS below @ 1264.25 & 1261 LVNs @ 1279 (within value) and 1287, 1295.
I’m still half expecting it to return to 1331 before turning around. So what we have now may be a smaller balance area within a larger one.
You can see the balance areas here:

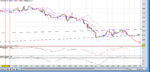
Expectations:
1 – Move down to 1260 and back up to 1287 and then down again – effectively balanced in the area we came to on 3rd June
2 – More vertical development with a bounce downwards off one of the LVNs @ 1264, 1260.
Longs 1260, 1264
Shorts 1287/1295.
Consider shorting 1260/1264 IF it moves down through them with conviction and bounces back.
Really a day to play it by ear as it’s not clear at this point where this market wants to head.
Note - the whole point of this is to have some ideas where the market is heading based on the action I see. If it moves up or down.
Note also that this is not something I pay much attention to during the day. It is something I want to gain experience in. I can only do that by doing the analysis on a daily basis and then deciding if I need to fully commit to it. It's only 20 minutes a day and so it's worth the additional work.
Asia Up
ES overnight well down, Europe Mixed
Interesting day – it seems that we are balancing around 1262-1282 with Value @ 1281-1271.
LVNS below @ 1264.25 & 1261 LVNs @ 1279 (within value) and 1287, 1295.
I’m still half expecting it to return to 1331 before turning around. So what we have now may be a smaller balance area within a larger one.
You can see the balance areas here:
Expectations:
1 – Move down to 1260 and back up to 1287 and then down again – effectively balanced in the area we came to on 3rd June
2 – More vertical development with a bounce downwards off one of the LVNs @ 1264, 1260.
Longs 1260, 1264
Shorts 1287/1295.
Consider shorting 1260/1264 IF it moves down through them with conviction and bounces back.
Really a day to play it by ear as it’s not clear at this point where this market wants to head.
Note - the whole point of this is to have some ideas where the market is heading based on the action I see. If it moves up or down.
Note also that this is not something I pay much attention to during the day. It is something I want to gain experience in. I can only do that by doing the analysis on a daily basis and then deciding if I need to fully commit to it. It's only 20 minutes a day and so it's worth the additional work.
robster970
Guest Author
- Messages
- 4,567
- Likes
- 1,390
Really a day to play it by ear as it’s not clear at this point where this market wants to head.
That's every day for me Pedro 😱
robster970
Guest Author
- Messages
- 4,567
- Likes
- 1,390
Listen to your fears and train them to operate successfully.
Quality advice Pat. 😀
Pat494
Legendary member
- Messages
- 14,614
- Likes
- 1,588
Very flat isn't it ?
Just when I thought it had been flat for a while, it starts climbing.
I see an EOD high of about 1288.
Pat494
Legendary member
- Messages
- 14,614
- Likes
- 1,588
Spain says it is being shut out of markets
* All of the euro zone's major economies in decline
* Futures off: Dow (NYSE: DPD - news) 29 pts, S&P 1.6 pts, Nasdaq (Nasdaq: ^NDX - news) 9.5 pts (Updates prices, adds European data, byline)
NEW YORK (Frankfurt: A0DKRK - news) , June 5 (Reuters) - U.S. stock index futures fell in a choppy session on Tuesday as traders positioned for the outcome of emergency talks among the Group of Seven industrialized nations to tackle a deepening euro zone crisis.
Adding to the bearish sentiment, all of the euro zone's major economies are now in various states of decline, according `to business surveys that suggested even Germany is no longer immune to the crisis.
German debt prices rose and Spanish bond yields briefly jumped after Spain's treasury minister said the country was effectively shut out of the financing market. Spain's two-year yields rose above 5 percent for a fifth straight session while the 10-year held steady near 6.4 percent.
The S&P 500 was flat for the day on Monday after a steep decline last week as investors weighed low prices against the backdrop of Europe (Chicago Options: ^REURUSD - news) struggling with debt and stalling economies.
"Valuations are extremely attractive, dividend yields compared to Treasuries are at (multi-year) highs, but the global macro overhang can certainly create another down step in the short term," said Oliver Pursche, president at Gary Goldberg Financial Services in Suffern, New York.
"I'd be genuinely surprised if at the end of the meeting the G7 came out with concrete steps of what they are going to do," said Pursche.
S&P 500 (SNP: ^GSPC - news) futures fell 1.6 points and were below fair value, a formula that evaluates pricing by taking into account interest rates, dividends and time to expiration on the contract. Dow Jones (DJI: ^DJI - news) industrial average futures fell 29 points, and Nasdaq 100 futures lost 9.5 points.
The Institute for Supply Management releases its U.S. non-manufacturing index for May at 10 a.m. (1400 GMT). Economists in a Reuters survey forecast a reading of 53.5, a repeat of the April figure.
Facebook Inc was down more than 1 percent in light premarket trading after reaching a low of $26.44 on Monday. Four out of five Facebook users have never bought a product or service as a result of advertising or comments on the social network site, a Reuters/Ipsos (Munich: 923860 - news) poll showed.
.
Hi dp,
I use 12 14 14 and yes I use them always as I hope to get more and more used to this set of figures. I try thio reduce the number of variables to as few as possible to make it easier.
Hope this helps.
Unless I find better ones
Ok, I just tried a bit of your set of figures and its not that much difference between from the widely used 8 18 9 which is my fav. I ve heard of a 5 9 2 which I tried but its way to fast.
Pat494
Legendary member
- Messages
- 14,614
- Likes
- 1,588
Trying a short@ 1282.1
Stop 1287.3
Limit 1273.
Me too