Pat494
Legendary member
- Messages
- 14,614
- Likes
- 1,588
Long here
Hit my target which is fairly unusual for me.
Long here
Nice one Pat.
Closed my long a little early as its a counter trend trade and feel the bears are still running the show,would not be suprised if we re-test the lows in the main session.
Tks
That's why I asked what time frame you are using because it has been trending up since 3 am. I am guessing daily ?
Had a quick toe dip - in and out since for a quickie
PMSL - just got in.....
Friend brought his missus round to stay with us before they flew off from the airport. I took him out for an Italian and the 2 girls stayed @ home and polished off a bottle of wine (or 2).
My mates missus ended up having a drama in our house, then she stormed off fook knows where. In the end, we had to take him to the airport on his own. Her location remains a mystery.
Now my own missus is not talking to me - angry through osmosis I think. Women + alcohol + a fairly innocent comment = SHOWTIME!
Will pass on trading today...
Women, eh?
If it reaches 1271 then I will prolly short
On second thoughts it may be a pivot point for a pullback.
Patience is needed
Can you guys please critique this trade?
I don't know much about market profile/volume profile, but I decided to give it a shot. Two screenshots are attached both giving my reasonings for getting in the trade, forgive me if this seems basic, I'm a newb.
entry
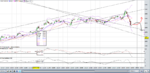
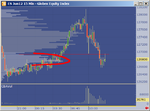
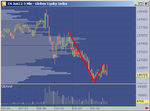
1. the 15 min chart shows a developing value area circled in red. We get a price spike above that value area so I wanted to short the top of it
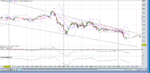
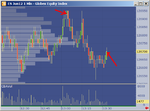
2. the 5 minute chart shows a pullback in a downtrend. I'm shorting the pullback in hopes of trend continuing. I get in 1 tick off the high of the pullback at 1269.25. Price rebounds on a quick spike up but I don't add to my position.
stop
I was planning on giving myself a stop at 1272 which would prove that my profile analysis was wrong since price would be moving back up into the value area earlier in the day.
target
Don't really have a target, trade is in my favor now, could just be luck. I've pretty much been trying to scalp but I figured I'd take this trade on a longer timeframe. Price just hit 1265.25 but just hit some support and bounced. Perhaps I should've just exited as I wrote this post. Let me get back to the screen..
edit:
exit
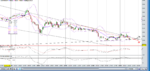
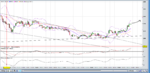
Attached a final 1 minute chart. You can see the volume spike that I mentioned above. I've marked out my exit at 1267.00, price was spiking up and I'm got scared and didn't want to give too much of my profits back. Stupid reason to exit, letting my worries/fears dictate my executions, but its really cause I'm not confident in my methods.
Yup up it is