RSI-7 Trend Continuation musings

trendie

Legendary member
Messages
6,875
Likes
1,433
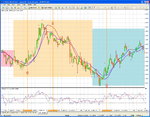
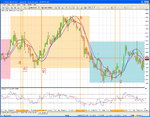
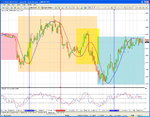
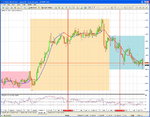
I am an ardent follower and supporter of bansirs RSI thread, whereby he searches for potential reversals using RSI-14 via divergences. (ie, prices print higher-high while the indicator prints a lower-high, and vice versa)

Being a dyed-in-the-wool trend-follower, (I dont want to stand in the way of the hurtling train hoping I can change its direction; rather, I prefer to watch as others get mown down, and only jump on-board once the train is already moving in the new direction) I mused over using RSI as a simple trading system.

I am using RSI-7 (just to get more OB(80) and OS(20) signals per day) *

Now, being a trendie, rather than a reversie, I knocked this trnd-continuation idea up.

When RSI-7 breaches the 50-line you are on ready.
Let it fall back towards the 50-line, you are on aim.
When it finally hooks back once more, you fire.

I am using bansirs 12-SMA. along with 36-Hull-MA as comparison. (I like the switching of colours when up/down, as well as the smoother shifts with Hulls)
I will use these MAs to give me a trend-direction. (only take hooks in its direction)

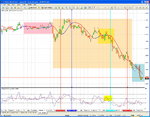
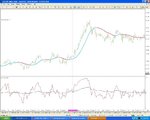
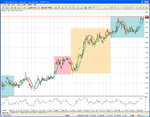
5 charts attached illustrating the ideas. I have cherry-picked the better ones. No doubt there are some duff signals. But you get the idea.

I dont use this (yet), but was curious at how simple it all felt.
Profit targets yet to be defined.
Stop-losses, as always for me, the previous high/low plus about 5 pips, so you can gauge whther you want to take it.

It seems to get on board on the momentum.

* when trying out new systems, I ask myself how many signals would I prefer per day, and set my parameters by eyeballing how many signals it would trigger per 7-am-4pm sessions. this way I get good sized bites out of the day. I normally look for parameter settings that give 2-3 singals per chart per 7-am-4pm sessions.

NB: the red-line on the RSI is a 7-SMA on the RSI-7 itself. I am working out how to deal with chop, so its a work in progress.

NB2: no doubt this technique has already been described elsewhere, in which case apologies for copying.
 

Attachments

  • jul-21-a.jpg
    jul-21-a.jpg
    320.4 KB · Views: 1,052
  • jul-22a.jpg
    jul-22a.jpg
    294 KB · Views: 817
  • jul-23a.jpg
    jul-23a.jpg
    315.6 KB · Views: 744
  • jul-24a.jpg
    jul-24a.jpg
    342.4 KB · Views: 671
  • jul-25a.jpg
    jul-25a.jpg
    351.4 KB · Views: 628
this was something similar that I originally publisehd on Tom's (t_d) pin bar thread, the Tunnel referred to being the now maligned Vegas Tunnel of 144 & 169 MAs on 60 minute charts.


1. EMAs above Tunnel = bullish
2. RSI above 50 = bullish
3. RSI recently crossed over 50 and survived re-tests = bullish
4. RSI crossed over MA = bullish
5. Price EMAs crossed over = bullish
6. Trade plan, Stop Buy next open above previous day's high.

point 1 confirms the main trend direction
point 3 seems to be the same as your main idea
point 4 seems to take care of the MA cross over question
point 5, I use 8 & 21 EMAs
point 6, i tend to use Stop entries and thus go for fewer trades

so sorry, nothing new here from me, just words of encouragement that your idea is worth exploring .....although there's probably far too few triggers for you ?

r_e
 
thought it wasnt new.
will search out your post about the Vegas tunnel.

I suppose the main point was that trading in the direction of an existing trend seems better in the long run than seeking out tops and bottoms.

hope it gives some something to think about in terms of rates of successful trades against losing ones.

EDIT: think I've found your "vegas" post on T_Ds thread. thanks for that.
http://www.trade2win.com/boards/381242-post1225.html
 
Last edited:
chuffin 'eck.
the RSI-7 EJ trades here did better than my live-system!
(and my live rules have a couple of more indies. this has effectively just two.)

the GBPUSD was choppy.
the EURUSD gave a good morning trade, but suffered from choppiness in the faternoon.
(so, perhaps, one good trade of more than 30-40 pips, and stay out, perhaps? but then, I would have missed the EJ second trade.)
 

Attachments

  • jul28-EJ.jpg
    jul28-EJ.jpg
    312.8 KB · Views: 541
  • jul28-GU.jpg
    jul28-GU.jpg
    313 KB · Views: 383
  • jul28-EU.jpg
    jul28-EU.jpg
    317.2 KB · Views: 407
chuffin 'eck.
the RSI-7 EJ trades here did better than my live-system!
(and my live rules have a couple of more indies. this has effectively just two.)

the GBPUSD was choppy.
the EURUSD gave a good morning trade, but suffered from choppiness in the faternoon.
(so, perhaps, one good trade of more than 30-40 pips, and stay out, perhaps? but then, I would have missed the EJ second trade.)

i'm not knocking you, i'm a believer, but looking at the chart in retrospect, i can imagine classical chartists calling a Long, 5 or 6 bars after your signal, based on a Bull Flag, or whatever they call it.

whorses for corsets i guess ....
 
early finish today.

the idea doesnt account for news. need some rules.
also, when the market is ranging, the Hulls effectively flatline, and triggers shouldnt be taken.
one of the marked areas show perhaps a hook-back could have been taken even when the RSI-7 didnt first get over the 50-line. Maybe use ADX strength as refinement? (if ADX over x-vlaue, take any hook??)

still havent defined exits or profit-target points, or stop-losses.
but the entries seem to be pretty tight.
 

Attachments

  • jul-29-eu.jpg
    jul-29-eu.jpg
    304 KB · Views: 432
  • jul-29-gu.jpg
    jul-29-gu.jpg
    310.7 KB · Views: 445
  • jul-29-ej.jpg
    jul-29-ej.jpg
    322.4 KB · Views: 433
another interesting day.
am getting maybe two too many trades per chart.
in a day, I want about 2 or 3 trades to get best bites out.
perhaps I should lengthen the Hull to reduce trades, as RSI-7 is trigger, and seems to be ok-ish.

anyway;
EJ: I have markjed a yellow square on the RSI-& on todays chart, as it didnt quite manage to break below the 50 to get the "steady" signal. (the Hull changing colour is the "ready", and teh RSI-& hooking back the "go") the horiz line is marked as purple, to indicate a hindsight trigger.

GU: the yellow square indicates an iffy trigger. the Hull has only just changed. i hindsight, I wouldnt have taken this as I want to see the Hull already in the new colour.
the second yellow square indicates where I would have lost my nerve, as Hull changes, but doesnt give an RSI-signal. I would have bailed out.

EU: the yellow square shows a hook, but not above the 50-line. in hindsight the trend is sharp, but valid. maybe I need to muse on taking triggers by evaluating the strength of the trend, but this introduces opinion.
 

Attachments

  • jul30-ej.jpg
    jul30-ej.jpg
    327.2 KB · Views: 442
  • jul30-gu.jpg
    jul30-gu.jpg
    312.4 KB · Views: 473
  • jul30-eu.jpg
    jul30-eu.jpg
    301.7 KB · Views: 509
one final set of pics using RSI-7.

poor day overall, due to lack of trend, then kapow! a news event.
but then again, any trend-following system on 5-mins would have been caught out, I reckon.
So, either use ADX, or just make a judgement call once you see the narrow range over a 2-hr period, and then stop trading that particular session. (ie, it happened during the euro-session, so perhaps best to stop trading until the US opens, and hope it goes all trendy).

additionally, I personally dont like to trade news, but an observation I may have already made elsewhere, is that spikes tend to return to their original place, and action continues as if the spike never happened. What I am saying is rather than trade the news itself, trade the reaction once the dust has settled. (fading the move, once it finishes the initial move) please note this is merely an observation. you can verify or disagree by looking back to dozens of news events, and see for yourself.

what started off as a musing, I may decide to use for real! (after a bit of more work)
It has only two moving parts (RSI and Hull), and is actually a far simpler idea than some of the ideas I have played with before. (which uses CCI, MAs, and some Keltners (actually, if you show CCI and RSI side by side, the results are almost identical, except the CCI is not limited by the 0-100 zones))

I am only showing the after-news trades for completeness. In real life, I would stay out until the next day.
hope you have enjoyed this short sequence of musings.
 

Attachments

  • jul31-eu.jpg
    jul31-eu.jpg
    312.6 KB · Views: 484
  • jul31-gu.jpg
    jul31-gu.jpg
    315.2 KB · Views: 413
  • jul31-ej.jpg
    jul31-ej.jpg
    300.7 KB · Views: 372
Hi Trendie,

thanks for the musings.

I have been looking at this as well, even though I am trying to get away from indicators and look at daily support and resistance levels, but i do get bored !!

I have added 50 rsi as a sort of dynamic support level for the rsi to pullback to, I have only looked at it briefly , maybe it will help ?

cheers
Ian
 

Attachments

  • eurusd.JPG
    eurusd.JPG
    133.3 KB · Views: 338
I was thinking about ianps idea of dynamic support, which helps to give a better direction.
Have also posted (elsewhere) a Kaufman2.mq4 file today showing adaptive moving averages.
But, as per ianps point, better to get away from complex maths indicators.

So, have a look at the Ichimoku version.
I have used 12 for the shorter (red) line, and 36 for the longer (blue) line.
(Ichimoku lines show the ((High - Low) / 2 ), so its the midpoint.
Notice how the lines move sharply when volatile, but flatten when ranging.
Not perfect by any means, but a far simpler representation, dont you think?
(the biggest probs with MAs, is the showing of "weakness" when the market is taking a breather going sideways, and sometimes arbitrarily giving a reversal signal. I go into this at even greater length in my "enlightenment" War-And-Peace post)

anyway, the other pic is showing the 12-SMA and 36-HMA for comparison. note the wiggling when the market appears to falter; this would give rise to whippy trades. the Ichimoku merely flattens.

NB: the thinner lines blue-red lines are my attempts to draw dynamic sup/res; its a modifed Ichimoku showing Highs/Lows of the past 36 bars. (all I did was change the calculation of the original Ichimoku mq4 file)
 

Attachments

  • rsi7_mas.jpg
    rsi7_mas.jpg
    312.5 KB · Views: 323
  • ichimoku_12_36.jpg
    ichimoku_12_36.jpg
    325.9 KB · Views: 320
Last edited:
Lots of good work going on in this thread. Cant help but think the the more you look and improve it the more it will fail long term. Why not just stick with the basic divergence with good discipline and money management.....u could add volume as well though.
 
Lots of good work going on in this thread. Cant help but think the the more you look and improve it the more it will fail long term. Why not just stick with the basic divergence with good discipline and money management.....u could add volume as well though.

you are right.

the reason for these musings was really to illustrate that trading a continuation might be more profitable than trading reversals from divergences.
There is a thread by bansir using RSI-14 which was the inspiration for this, and so I used his indicators where possible. (eg, RSI and SMA-12)

I suppose its all about mindset. some prefer picking tops and bottoms; some prefer jumping onto the new momentum once its started.

absolutely right about MM.
 
Yep, Im a great beleiver in divergence and mm,wish Id looked properley at it years ago Id have saved 10s of 1000s.It is by far the most accurate method for tight pre defined stops and often big moves, trend or counter trend. I only butted in as I am totally also convinced that the more you add to a system/formulae the more it fails and if you put a shotgun to my head and said what do you think doesnt work it would be that one thing Id advise people to avoid.Ill pay Mr Bansir a more detailed look. Wheres the best place to start,thanks
 
Top