There is more to smoothing an RSI than just taking a moving average after the RSI is computed. By applying some advanced filters in the process of computing the RSI you can not only get better smoothing but also enhance the turning points of this proven indicator.
Smoothing indicators usually means making a tradeoff between the amount of smoothing you desire and the amount of lag you can stand. It turns out that the RSI can be smoothed and enhanced with minimum lag penalty. The thesis of this article is to show you how this is done.
Welles Wilder defined the RSI as
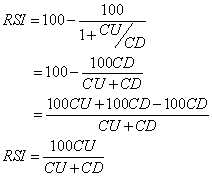
RS is shorthand for Relative Strength. That is, CU is the sum of the difference in closing prices over the observation period where that difference is positive. Similarly, CD is the sum of the difference in closing prices over the observation period where that difference is negative, but the sum is expressed as a positive number. When we substitute CU/CD for RS and simplify the RSI equation, we get
In other words, the RSI is the percentage of the sum of the delta closes up to the sum of all the delta closes over the observation period. The only variable is the observation period. To have maximum effectiveness the observation period should be half of the measured dominant cycle length. If the observation period is half the dominant cycle, then for a pure sine wave, the closes up is exactly equal to the total closes during part of the cycle from the valley to the peak. In this case, the RSI would have a value of 100. During another part of the cycle - the next half cycle - there would be no closes up. During this half cycle the RSI would have a value of zero. So, in principle, half the measured cycle is the correct choice for the RSI observation period.
The Smoothing Trick
If the waveshape of market prices were a pure sinewave, CU would be a sinewave in phase with the prices and CU + CD in the denominator would sum to a constant value. In this case it would make little difference whether smoothing was done after the RSI was computer or whether the smoothing was done before the ratio in the computation is taken. As a practical matter, the denominator of the RSI calculation often swings in synchronization with the numerator. It is important that if smoothing is done prior to taking the ratio in the RSI calculation that the same amount of lag be introduced in both the numerator and denominator to retain their synchronization.
The real trick to enhancing the RSI through smoothing is to smooth the difference in closing prices before the RSI computation is started. Doing this, the inevitable little jiggles in CU due to those occasional down days that occur in up markets can be substantially reduced. Similarly, the jiggles in CD on those occasional up days that occur in down markets are also reduced. Further, smoothing all the differences in closing prices is mathematically identical to smoothing the sum of CU and CD. The end result of smoothing the differences in closing prices before computing the RSI is that not only is the RSI function smoothed, but also that the peak swings in the response are retained, or even enhanced. So the strategy is to smooth the difference in closing prices prior to computing the RSI using these smoothed values. The question that remains is what is the best way to do the smoothing.
IIR (Infinite Impulse Response) filters, such as the EMA (Exponential Moving Average), have a nonlinear phase response which results in different amounts of lag for the various frequency components in the smoothed waveform. On the other hand, FIR (Finite Impulse Response) filters, such as SMA (Simple Moving Average), produce the same lag for all frequency components in the smoothed waveform. For an "N" length FIR filter the amount of lag is (N - 1)/2. For example, a three bar SMA would have a lag of exactly one bar for all frequency components in its smoothed output and a two bar SMA would have a lag of only one-half a bar. So what value of N (the order of the filter) should we choose? Clearly, we want to minimize the order of the FIR filter to minimize the lag.
The frequency response of a two bar SMA is shown in Figure 1, where the frequency is normalized to the Nyquist sampling rate. Since there must be at least two samples per cycle, the highest frequency on this scale is a 2 bar cycle. The cycle period is computed as 2/(Normalized Frequency). The two bar cycle is nearly completely removed by the two bar SMA. This makes sense because the up-down sampling of a perfect 2 bar cycle exactly averages to zero in a 2 bar SMA. When we extend the length of the SMA to three bars we can use the notation for the coefficients of the SMA as:
That is, the sum of the coefficients must sum to unity. The frequency response of the three bar SMA is shown in Figure 2. In this case, the 3 bar cycle is completely removed, but there are residual contributions in the output from 2 bar cycles.
Continuing to increase the order of the FIR filter, if we select a four bar weighted coefficient filter as:
We see in Figure 3 that both the 2 bar cycle and 3 bar cycle are suppressed. Since N=4 in this case, the lag of this FIR filter is 1.5 bars. We can draw the general conclusion that the 2 bar cycle is suppressed only when N is even. Continuing to increase the order of the FIR filter, using even orders, a 6 bar weighted coefficient filter could be:
The interesting characteristic of this FIR filter is that the 2 bar, 3 bar, and 4 bar cycles are all suppressed, as shown in Figure 4. The lag penalty for this 6th order filter is 2.5 bars.
So, again, what is the best order of the filter to be used? I favor the 4th order filter because it only produces 1.5 bars of lag, and avoidance of lag is generally more important to trading that increased smoothing. The 4th order filter virtually completely removes the two bar and 3 bar variations in the differential closes. By eliminating these very short term variations in the differential closes, the Smoothed RSI (SRSI) is nearly free of disconcerting wiggles that lead to whipsaw trades. The SRSI is compared to the standard RSI in Figure 5 and is also compared to the standard RSI that is smoothed by a 4th order FIR filter in Figure 6. The EasyLanguage code to compute the SRSI is given in Figure 6. The EasyLanguage code to compute the SRSI is given in Figure 7.
Conclusion
The RSI can be greatly enhanced by smoothing the differential closes before the RSI function is computed. Not only are the short term variations removed, but the desirable shape of the indicator is enhanced. In particular, using even ordered and symmetrically weighted FIR filters, the specific short term variations are nearly completely removed. I hope this trim on an old and trusted indicator will serve you well.
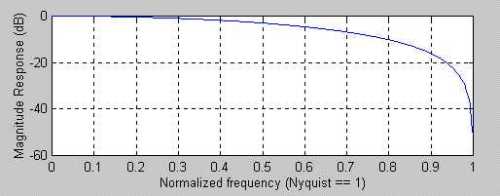
caption: Figure 1. A two bar Simple Moving Average Removes the Two Bar Cycle Component (Cycle = 2 / (Normalized Frequency)
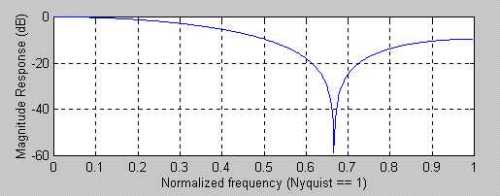
caption: Figure 2. A three bar Simple Moving Average Removes the Three Bar Cycle Component (Cycle = 2 / (Normalized Frequency)
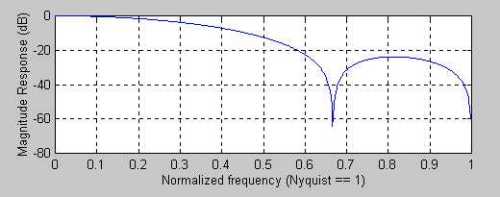
caption: Figure 3. A four bar Weighted FIR Filter Removes Both the Two and Three Bar Cycle Components (Cycle = 2 / (Normalized Frequency)
caption: Figure 4. A six bar Weighted FIR Filter Removes the Two, Three, and Four Bar Cycle Components (Cycle = 2 / (Normalized Frequency)
caption: Figure 5. The SRSI is much smoother than the standard RSI.
caption: Figure 6. The Turning Points of the SRSI are much better defined than a standard RSI that has been smoothed.
Smoothing indicators usually means making a tradeoff between the amount of smoothing you desire and the amount of lag you can stand. It turns out that the RSI can be smoothed and enhanced with minimum lag penalty. The thesis of this article is to show you how this is done.
Welles Wilder defined the RSI as
RSI = 100 - 100 / (1 + RS)
where RS = (Closes Up) / (Closes Down)
= CU / CD
RS is shorthand for Relative Strength. That is, CU is the sum of the difference in closing prices over the observation period where that difference is positive. Similarly, CD is the sum of the difference in closing prices over the observation period where that difference is negative, but the sum is expressed as a positive number. When we substitute CU/CD for RS and simplify the RSI equation, we get
In other words, the RSI is the percentage of the sum of the delta closes up to the sum of all the delta closes over the observation period. The only variable is the observation period. To have maximum effectiveness the observation period should be half of the measured dominant cycle length. If the observation period is half the dominant cycle, then for a pure sine wave, the closes up is exactly equal to the total closes during part of the cycle from the valley to the peak. In this case, the RSI would have a value of 100. During another part of the cycle - the next half cycle - there would be no closes up. During this half cycle the RSI would have a value of zero. So, in principle, half the measured cycle is the correct choice for the RSI observation period.
The Smoothing Trick
If the waveshape of market prices were a pure sinewave, CU would be a sinewave in phase with the prices and CU + CD in the denominator would sum to a constant value. In this case it would make little difference whether smoothing was done after the RSI was computer or whether the smoothing was done before the ratio in the computation is taken. As a practical matter, the denominator of the RSI calculation often swings in synchronization with the numerator. It is important that if smoothing is done prior to taking the ratio in the RSI calculation that the same amount of lag be introduced in both the numerator and denominator to retain their synchronization.
The real trick to enhancing the RSI through smoothing is to smooth the difference in closing prices before the RSI computation is started. Doing this, the inevitable little jiggles in CU due to those occasional down days that occur in up markets can be substantially reduced. Similarly, the jiggles in CD on those occasional up days that occur in down markets are also reduced. Further, smoothing all the differences in closing prices is mathematically identical to smoothing the sum of CU and CD. The end result of smoothing the differences in closing prices before computing the RSI is that not only is the RSI function smoothed, but also that the peak swings in the response are retained, or even enhanced. So the strategy is to smooth the difference in closing prices prior to computing the RSI using these smoothed values. The question that remains is what is the best way to do the smoothing.
IIR (Infinite Impulse Response) filters, such as the EMA (Exponential Moving Average), have a nonlinear phase response which results in different amounts of lag for the various frequency components in the smoothed waveform. On the other hand, FIR (Finite Impulse Response) filters, such as SMA (Simple Moving Average), produce the same lag for all frequency components in the smoothed waveform. For an "N" length FIR filter the amount of lag is (N - 1)/2. For example, a three bar SMA would have a lag of exactly one bar for all frequency components in its smoothed output and a two bar SMA would have a lag of only one-half a bar. So what value of N (the order of the filter) should we choose? Clearly, we want to minimize the order of the FIR filter to minimize the lag.
The frequency response of a two bar SMA is shown in Figure 1, where the frequency is normalized to the Nyquist sampling rate. Since there must be at least two samples per cycle, the highest frequency on this scale is a 2 bar cycle. The cycle period is computed as 2/(Normalized Frequency). The two bar cycle is nearly completely removed by the two bar SMA. This makes sense because the up-down sampling of a perfect 2 bar cycle exactly averages to zero in a 2 bar SMA. When we extend the length of the SMA to three bars we can use the notation for the coefficients of the SMA as:
C = [1 1 1]/3
That is, the sum of the coefficients must sum to unity. The frequency response of the three bar SMA is shown in Figure 2. In this case, the 3 bar cycle is completely removed, but there are residual contributions in the output from 2 bar cycles.
Continuing to increase the order of the FIR filter, if we select a four bar weighted coefficient filter as:
C = [1 2 2 1]/6
We see in Figure 3 that both the 2 bar cycle and 3 bar cycle are suppressed. Since N=4 in this case, the lag of this FIR filter is 1.5 bars. We can draw the general conclusion that the 2 bar cycle is suppressed only when N is even. Continuing to increase the order of the FIR filter, using even orders, a 6 bar weighted coefficient filter could be:
C = [1 2 3 3 2 1]/12
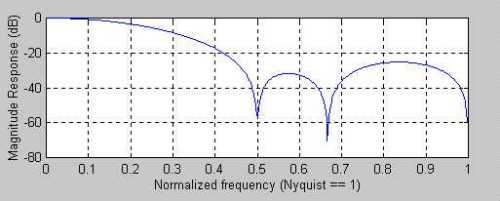
The interesting characteristic of this FIR filter is that the 2 bar, 3 bar, and 4 bar cycles are all suppressed, as shown in Figure 4. The lag penalty for this 6th order filter is 2.5 bars.
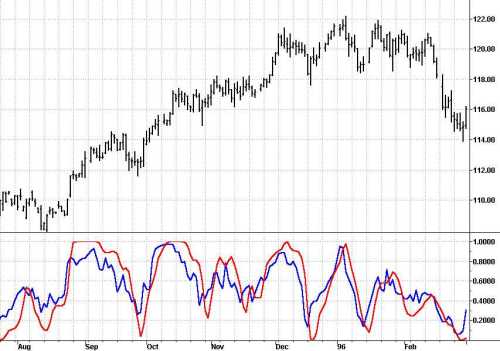
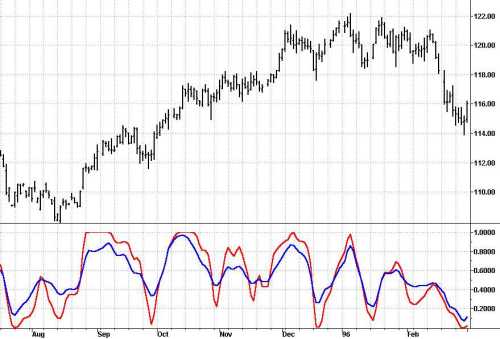
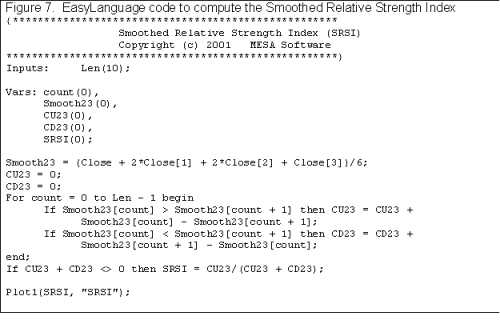
So, again, what is the best order of the filter to be used? I favor the 4th order filter because it only produces 1.5 bars of lag, and avoidance of lag is generally more important to trading that increased smoothing. The 4th order filter virtually completely removes the two bar and 3 bar variations in the differential closes. By eliminating these very short term variations in the differential closes, the Smoothed RSI (SRSI) is nearly free of disconcerting wiggles that lead to whipsaw trades. The SRSI is compared to the standard RSI in Figure 5 and is also compared to the standard RSI that is smoothed by a 4th order FIR filter in Figure 6. The EasyLanguage code to compute the SRSI is given in Figure 6. The EasyLanguage code to compute the SRSI is given in Figure 7.
Conclusion
The RSI can be greatly enhanced by smoothing the differential closes before the RSI function is computed. Not only are the short term variations removed, but the desirable shape of the indicator is enhanced. In particular, using even ordered and symmetrically weighted FIR filters, the specific short term variations are nearly completely removed. I hope this trim on an old and trusted indicator will serve you well.
caption: Figure 1. A two bar Simple Moving Average Removes the Two Bar Cycle Component (Cycle = 2 / (Normalized Frequency)
caption: Figure 2. A three bar Simple Moving Average Removes the Three Bar Cycle Component (Cycle = 2 / (Normalized Frequency)
caption: Figure 3. A four bar Weighted FIR Filter Removes Both the Two and Three Bar Cycle Components (Cycle = 2 / (Normalized Frequency)
caption: Figure 4. A six bar Weighted FIR Filter Removes the Two, Three, and Four Bar Cycle Components (Cycle = 2 / (Normalized Frequency)
caption: Figure 5. The SRSI is much smoother than the standard RSI.
caption: Figure 6. The Turning Points of the SRSI are much better defined than a standard RSI that has been smoothed.
Last edited by a moderator: