The SVEStochasticRSI is a powerful VertexFX client-side indicator that identifies market cycles and the strength of a trend.
As the name implies, it is an enhancement of the Stochastic RSI and was originally created by Sylvain Vervoort. The main advantage over the traditional StochasticRSI is that the method of calculating the RSI in this indicator is more responsive to price changes. As a result the lag is minimal.
In the first step we calculate the RSI using the enhanced SVE method. We use a smoothing co-efficient ALPHA, which is the square-root of the reciprocal period for calculating the RSI. The price changes used to calculate the normal RSI are multiplied by the smoothing co-efficient to derive the SVE RSI. In the next step we calculate the Stochastic value of this RSI which is called the SVEStochasticRSI.
The advantage of applying the Stochastic indicator to the RSI is that is when the price starts trending the indicator starts moving upwards or downwards very quickly thereby helping the traders identify the trend very quickly.
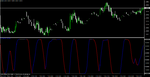
The indicator is painted BLUE when it is rising and RED when it is falling. It is recommended to use this indicator on H1 and higher time-frames.
BUY / EXIT SHORT - Enter LONG when the indicator turns BLUE at the zero level. If a SHORT position is open, exit the SHORT position when the indicator turns BLUE at any level. The stop-loss can be set to the nearest Swing Low. Traders are advised to employ a trailing stop when the trade turns profitable.
SHORT / EXIT LONG - Enter SHORT when the indicator turns RED at the zero level. If a LONG position is open, exit the LONG position when the indicator turns RED at any level. The stop-loss can be set to the nearest Swing High. Traders are advised to employ a trailing stop when the trade turns profitable.
As the name implies, it is an enhancement of the Stochastic RSI and was originally created by Sylvain Vervoort. The main advantage over the traditional StochasticRSI is that the method of calculating the RSI in this indicator is more responsive to price changes. As a result the lag is minimal.
In the first step we calculate the RSI using the enhanced SVE method. We use a smoothing co-efficient ALPHA, which is the square-root of the reciprocal period for calculating the RSI. The price changes used to calculate the normal RSI are multiplied by the smoothing co-efficient to derive the SVE RSI. In the next step we calculate the Stochastic value of this RSI which is called the SVEStochasticRSI.
The advantage of applying the Stochastic indicator to the RSI is that is when the price starts trending the indicator starts moving upwards or downwards very quickly thereby helping the traders identify the trend very quickly.
The indicator is painted BLUE when it is rising and RED when it is falling. It is recommended to use this indicator on H1 and higher time-frames.
BUY / EXIT SHORT - Enter LONG when the indicator turns BLUE at the zero level. If a SHORT position is open, exit the SHORT position when the indicator turns BLUE at any level. The stop-loss can be set to the nearest Swing Low. Traders are advised to employ a trailing stop when the trade turns profitable.
SHORT / EXIT LONG - Enter SHORT when the indicator turns RED at the zero level. If a LONG position is open, exit the LONG position when the indicator turns RED at any level. The stop-loss can be set to the nearest Swing High. Traders are advised to employ a trailing stop when the trade turns profitable.