RSIofPSAR is a VertexFX indicator that identifies trend reversals, it is based on two underlying indicators namely the Parabolic Stop-And-Reverse (PSAR) and the Relative Strength Index (RSI).
The PSAR indicator is very useful in trend-following techniques when the trend is clear. However, it leads to whipsaws in sideways markets leading to losses. The RSI indicator is useful in identifying trend reversals and sideways markets. RSIofPSAR is created by combining these characteristics from the two indicators providing use with a composite indicator the identifies trend reversals.
In the first step, we calculate the Parabolic Stop-And-Reverse (PSAR) of the price series. In the next step, we calculate the Relative Strength Index (RSI) of the PSAR calculated in the previous step. Instead of calculating the RSI using the standard technique, we use a smoothing co-efficient to eliminate the lag.
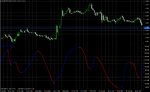
The RSIofPSAR is a bounded oscillator ranging between 0 and 100. It turns BLUE when it is rising and turns RED when it is falling.
BUY / EXIT SHORT - Enter LONG (or exit SHORT) when the RSIofPSAR turns BLUE from RED below the 50 level. Place the stop-loss below the nearest Swing Low. It is recommended to employ a trailing stop when the trade turns profitable.
SHORT / EXIT LONG - Enter SHORT (or exit LONG) when the RSIofPSAR turns RED from BLUE above the 50 level. Place the stop-loss above the nearest Swing High. It is recommended to employ a trailing stop when the trade turns profitable.
The PSAR indicator is very useful in trend-following techniques when the trend is clear. However, it leads to whipsaws in sideways markets leading to losses. The RSI indicator is useful in identifying trend reversals and sideways markets. RSIofPSAR is created by combining these characteristics from the two indicators providing use with a composite indicator the identifies trend reversals.
In the first step, we calculate the Parabolic Stop-And-Reverse (PSAR) of the price series. In the next step, we calculate the Relative Strength Index (RSI) of the PSAR calculated in the previous step. Instead of calculating the RSI using the standard technique, we use a smoothing co-efficient to eliminate the lag.
The RSIofPSAR is a bounded oscillator ranging between 0 and 100. It turns BLUE when it is rising and turns RED when it is falling.
BUY / EXIT SHORT - Enter LONG (or exit SHORT) when the RSIofPSAR turns BLUE from RED below the 50 level. Place the stop-loss below the nearest Swing Low. It is recommended to employ a trailing stop when the trade turns profitable.
SHORT / EXIT LONG - Enter SHORT (or exit LONG) when the RSIofPSAR turns RED from BLUE above the 50 level. Place the stop-loss above the nearest Swing High. It is recommended to employ a trailing stop when the trade turns profitable.