Technical indicators have long been misused by traders and investors alike. Many learn the traditional style of using the indicators and then try to massage the data to fit certain strategies of trading only to have them fail when the market conditions change. Others simply do not understand their use properly and misinterpret the data.
As a Chartered Market Technician and member for the Market Technician’s Association, I was required to gain a deep understanding of how most indicators and oscillators work. I was fortunate enough to learn some special tricks for using these indicators so that they work much better than originally intended, in any market!
One such modified indicator is the popular Relative Strength Index (RSI). I want to stress that my entries and exits for trades are triggered by price action and I use a core strategy taught at OTA in my own trading. The indicators I use are simply an odds enhancer or a support tool for decisions made from price action.
Most traders are familiar with the Relative Strength Index or RSI. It is an oscillator that measures the strength of up or down movements in price relative to the stock’s previous price movements. The typical readings for this indicator are 70-30. A reading of 70% means that the stock is overbought and likely to drop soon. The RSI crossing below the 70% line is sometimes taken as a sell signal. Conversely, a reading below 30% shows the stock to be oversold and perhaps ready to rise. A buy signal is said to be generated when the RSI crosses above 30.
The problem with using the RSI in this manner is that in a strong uptrend the RSI will typically use 40 as a support level, meaning that the RSI will not drop below 40 while the trend is intact. Look at the chart of the 2004 to 2007 bull market in the S&P 500 Index weekly chart.
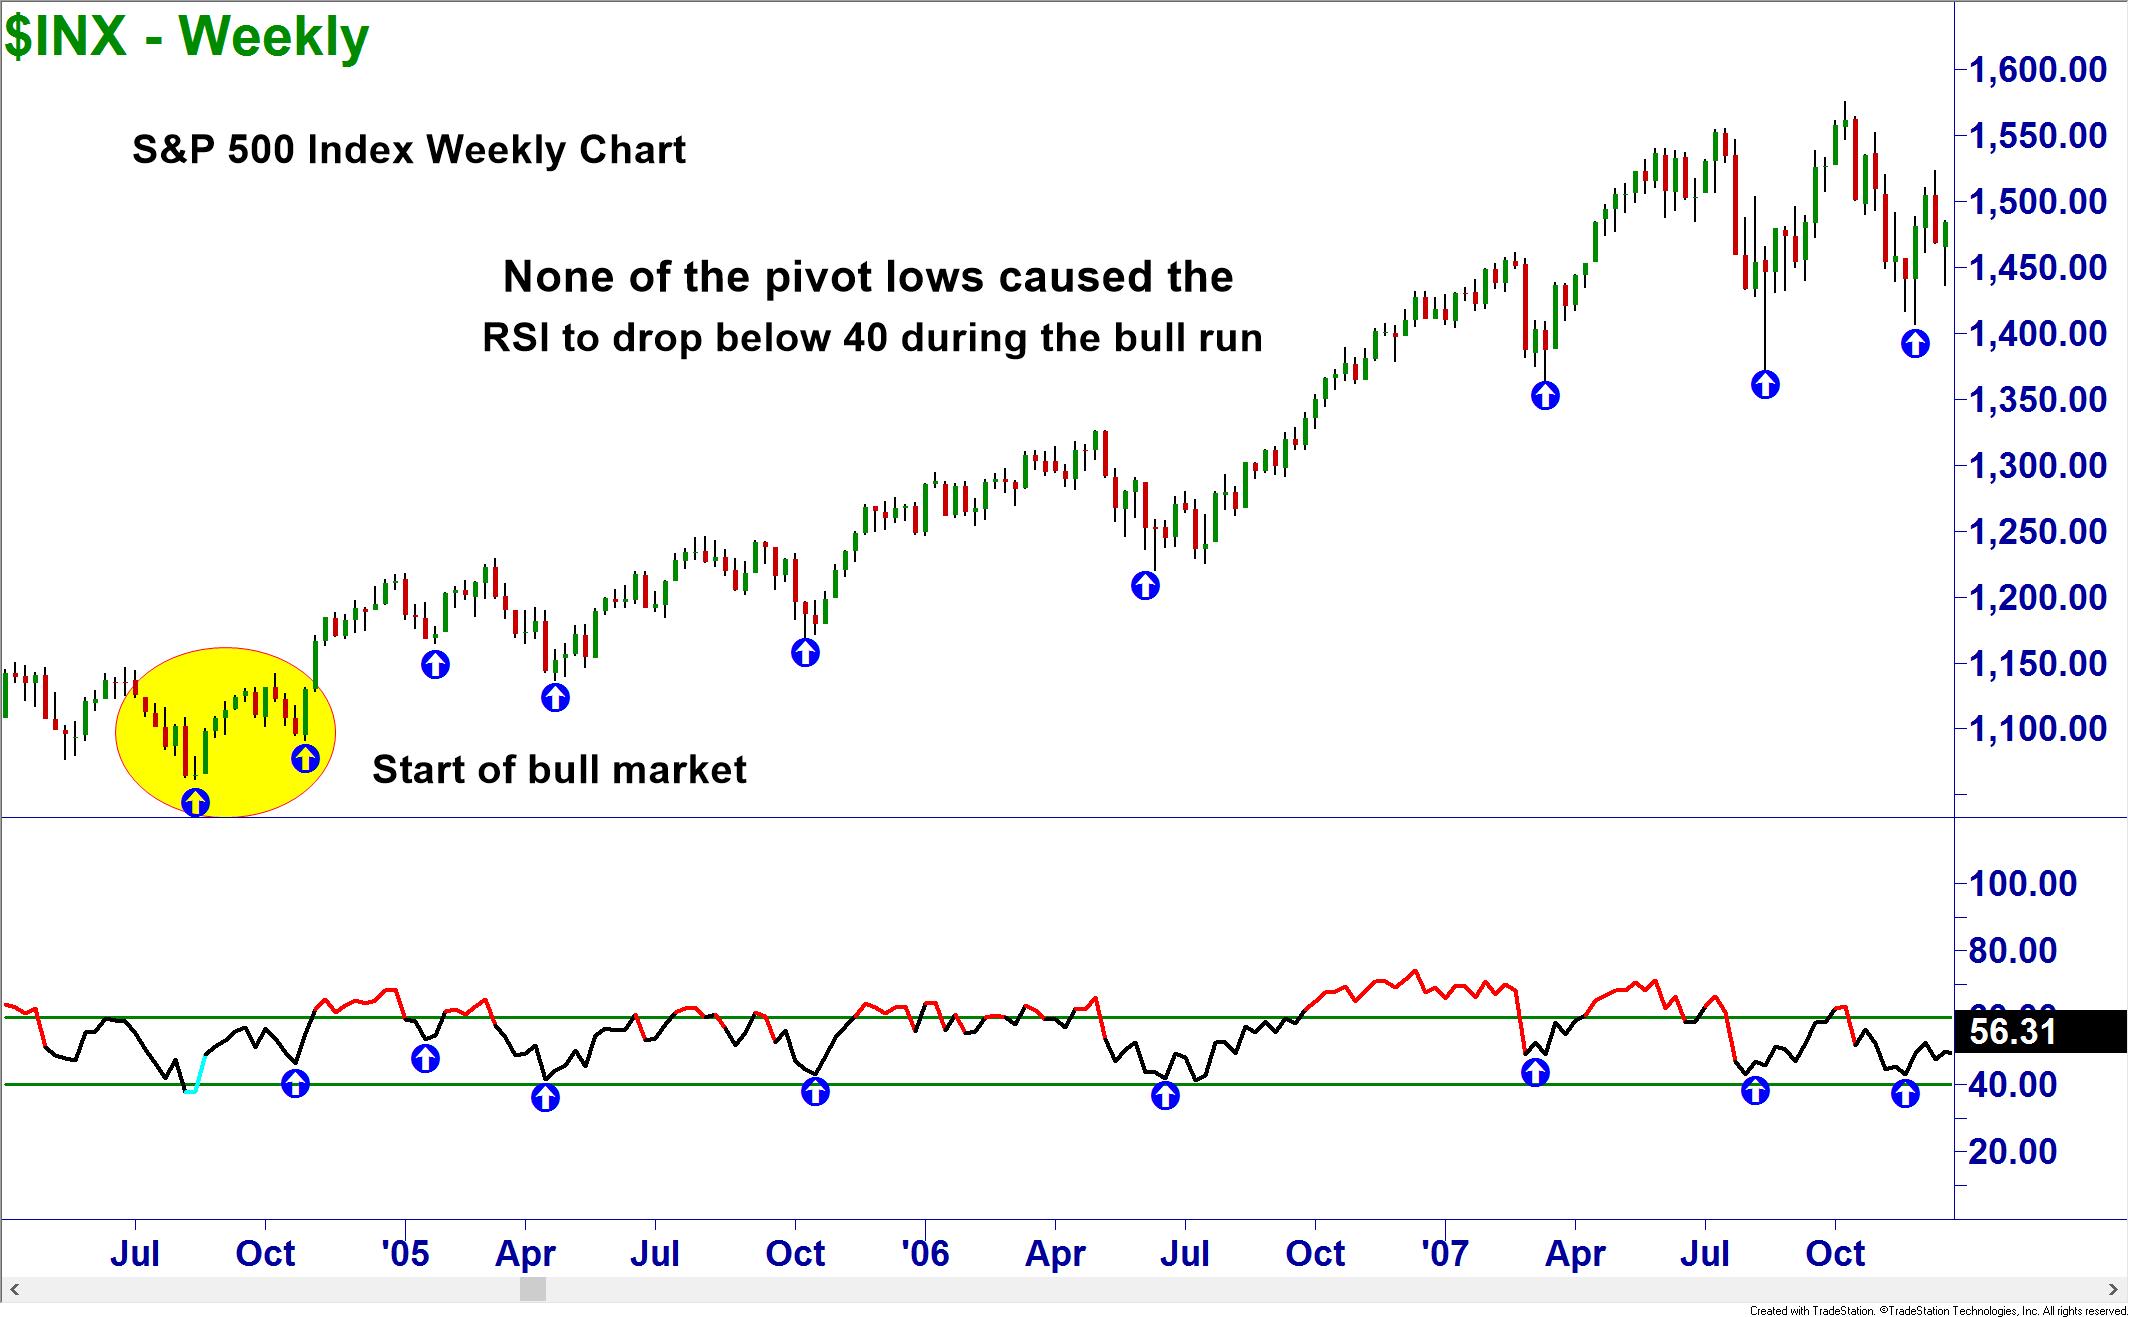
Fig 1
When price is in a strong downtrend, the RSI will use 60 as a resistance level. The RSI will not break above 60 until the trend is breaking. You can see this in the 2008 bear market. All of the rallies failed to move the RSI above 60.
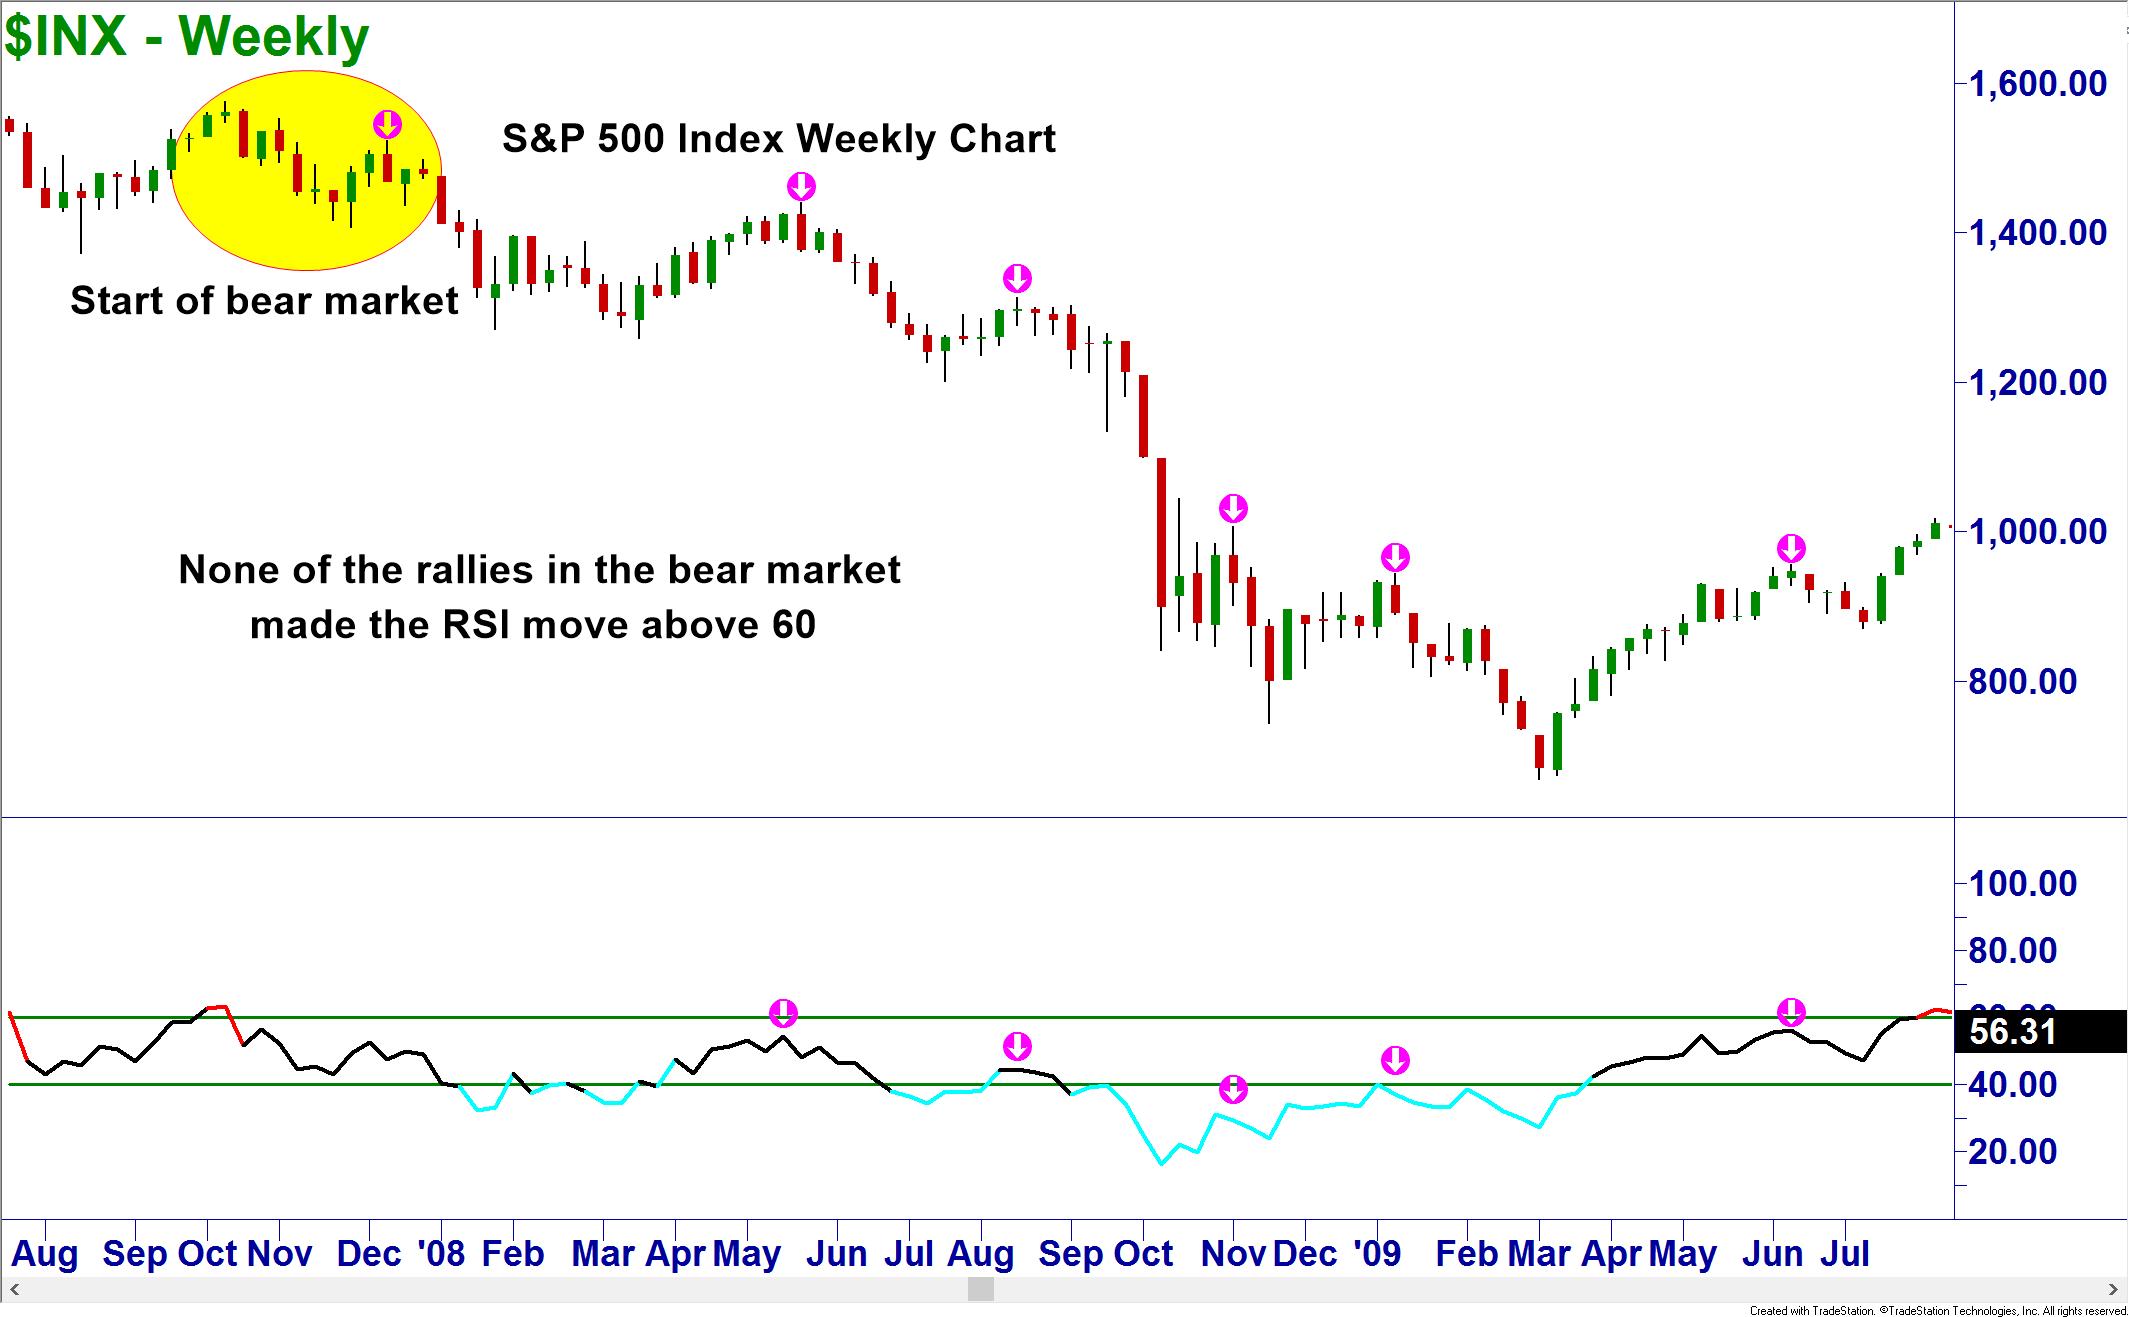
Fig 2
When we are trading in the trend, we want to let our profits run as long as possible and do not want to enter into trades with a low probability of working. Since the RSI uses 60 and 40 as boundaries for trends, the traditional buy and sell signals will not work as you cannot get a buy signal below 30 in a strong bull trend nor will you see a sell signal from a cross below 70. Instead, a use for the RSI would be for determining the trend direction and strength of the trend.
Going back to the weekly chart of the S&P 500, the trend change from bull to bear becomes confirmed once the RSI drops below 40. There were earlier signals that educated traders could have seen but those who waited for the confirmation from the RSI were still able to avoid the pain of the large price drop or even profit from it.
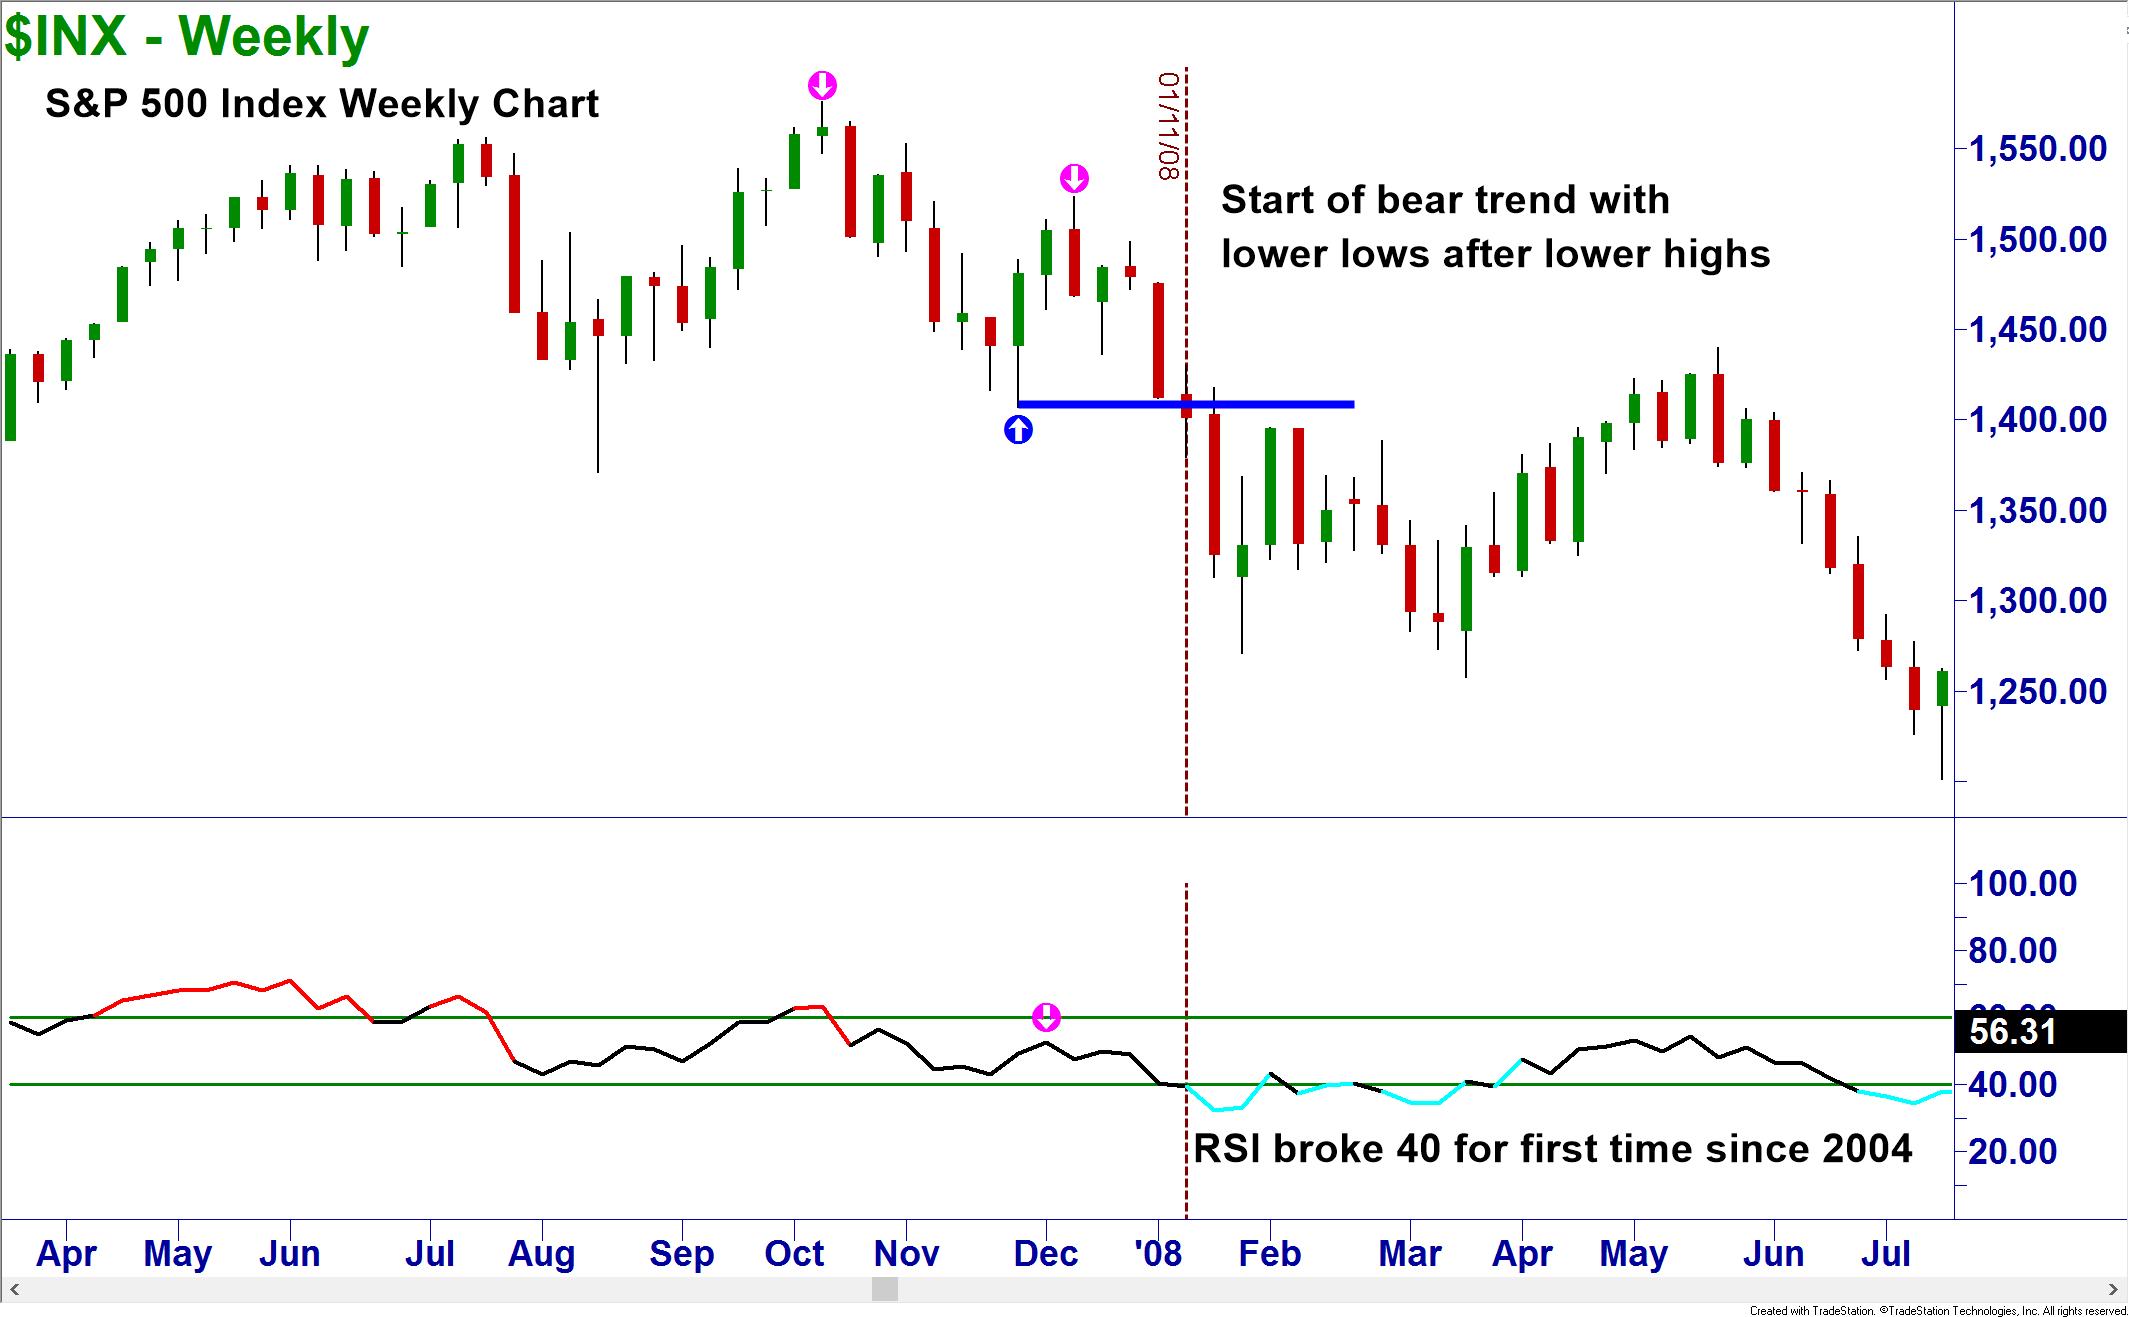
Fig 3
The end of the bear market and start of the bull was ushered in with higher lows and higher highs accompanied by a break above 60 on the RSI.
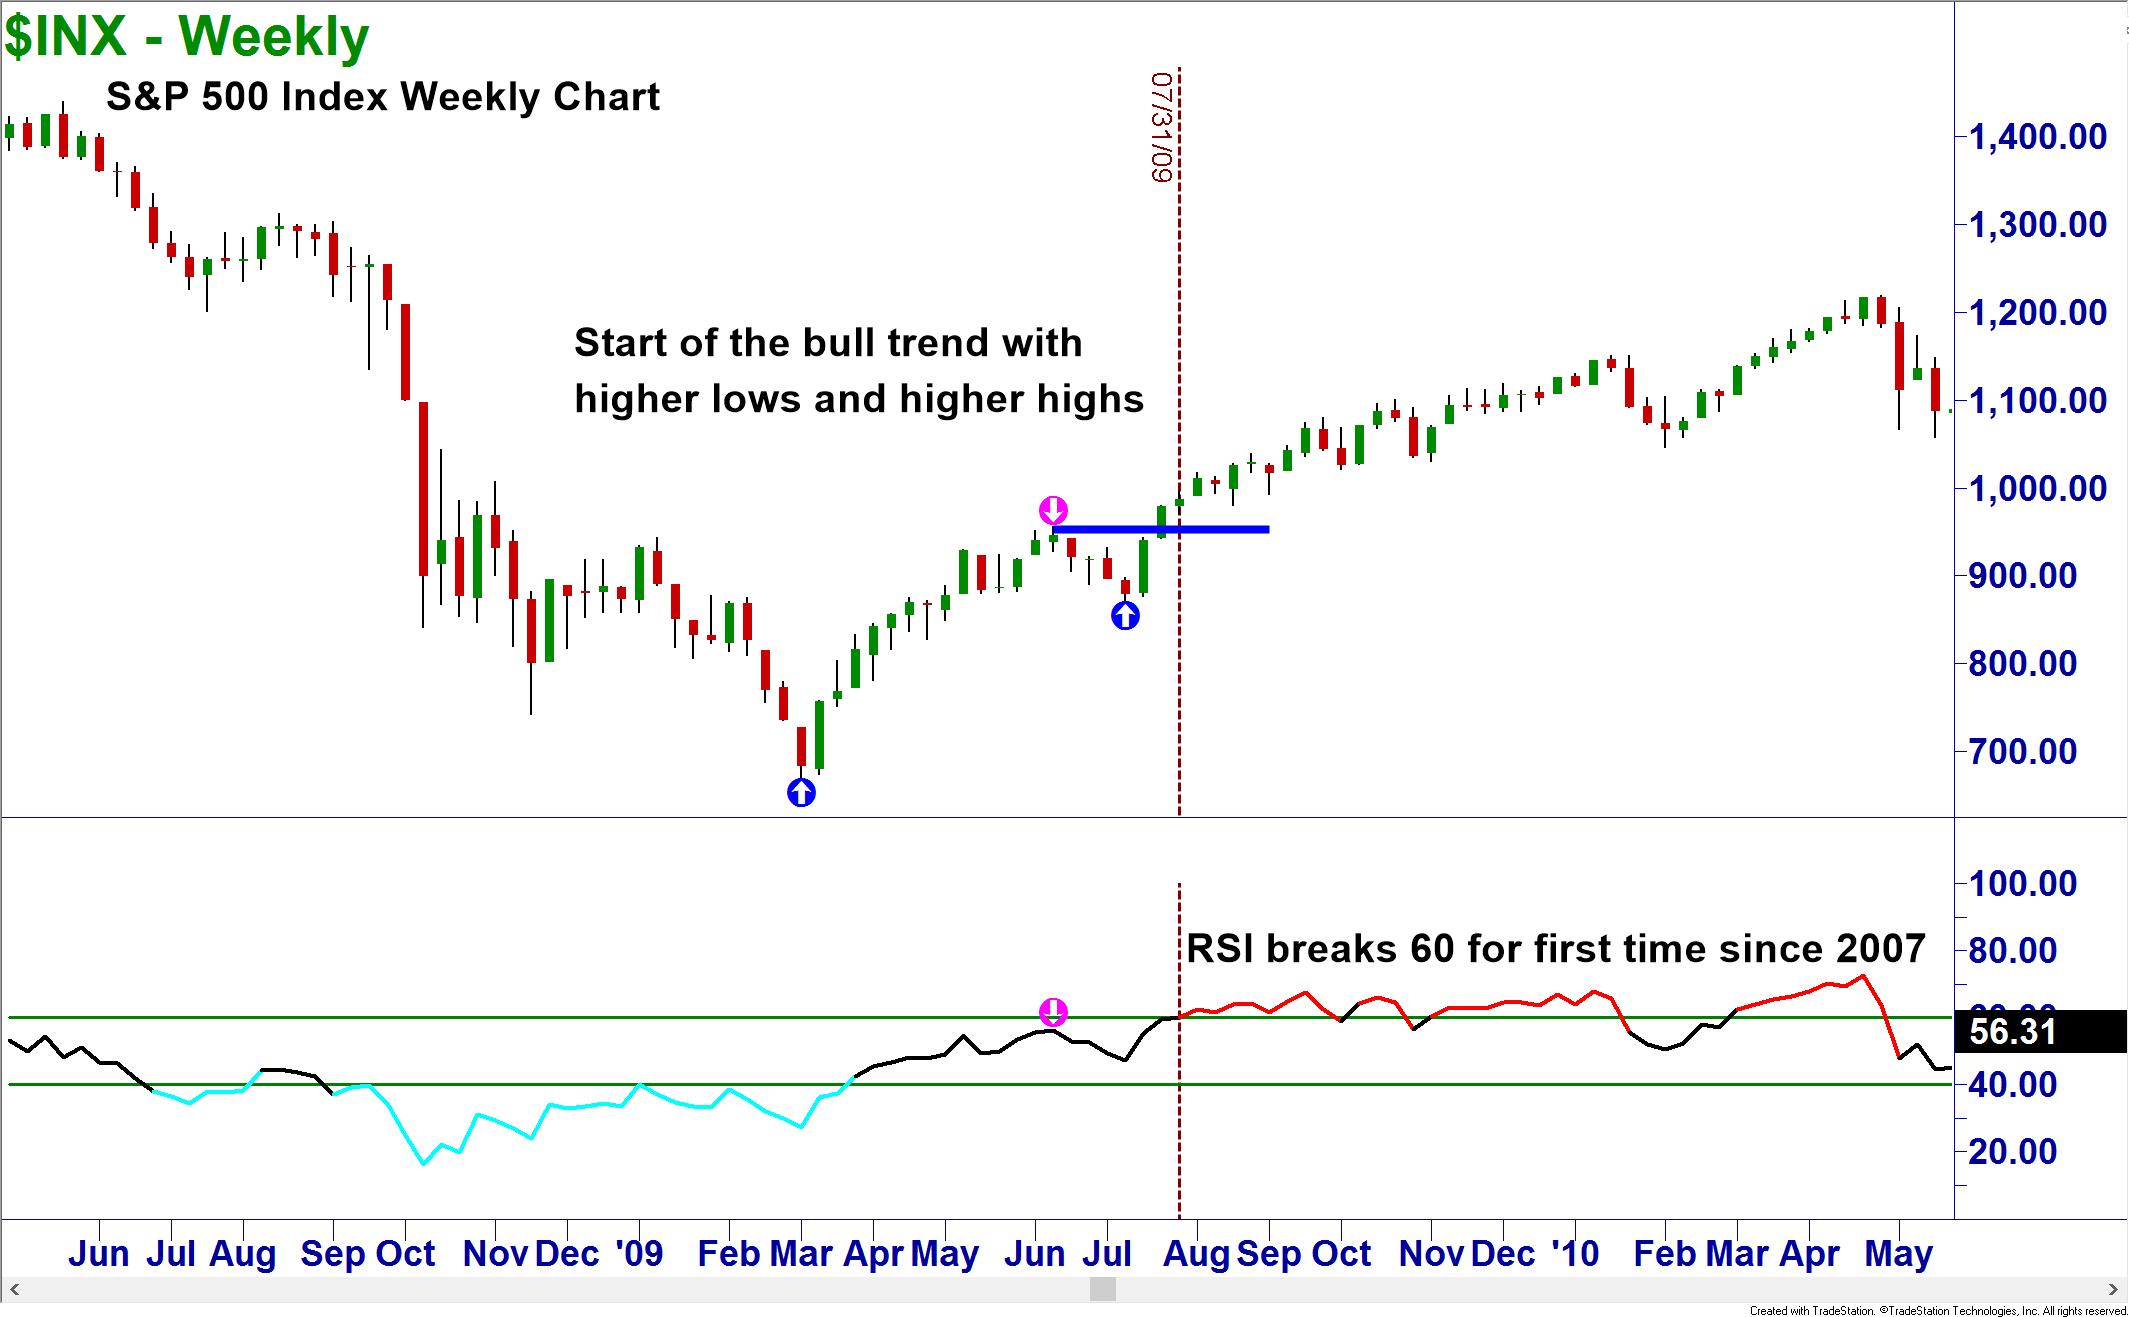
Fig 4
You are probably wondering what the current market looks like. The bull trend was killed off with lower highs and lower lows in 2015. The RSI also broke below 40 and has been unable to get above 60 even though the index itself has made all-time highs. This does not mean we are in a bear trend, but we are not in a bull one either. 2016 has seen the S&P trading in a sideways channel and time will tell which way it will break. The RSI will tell also.
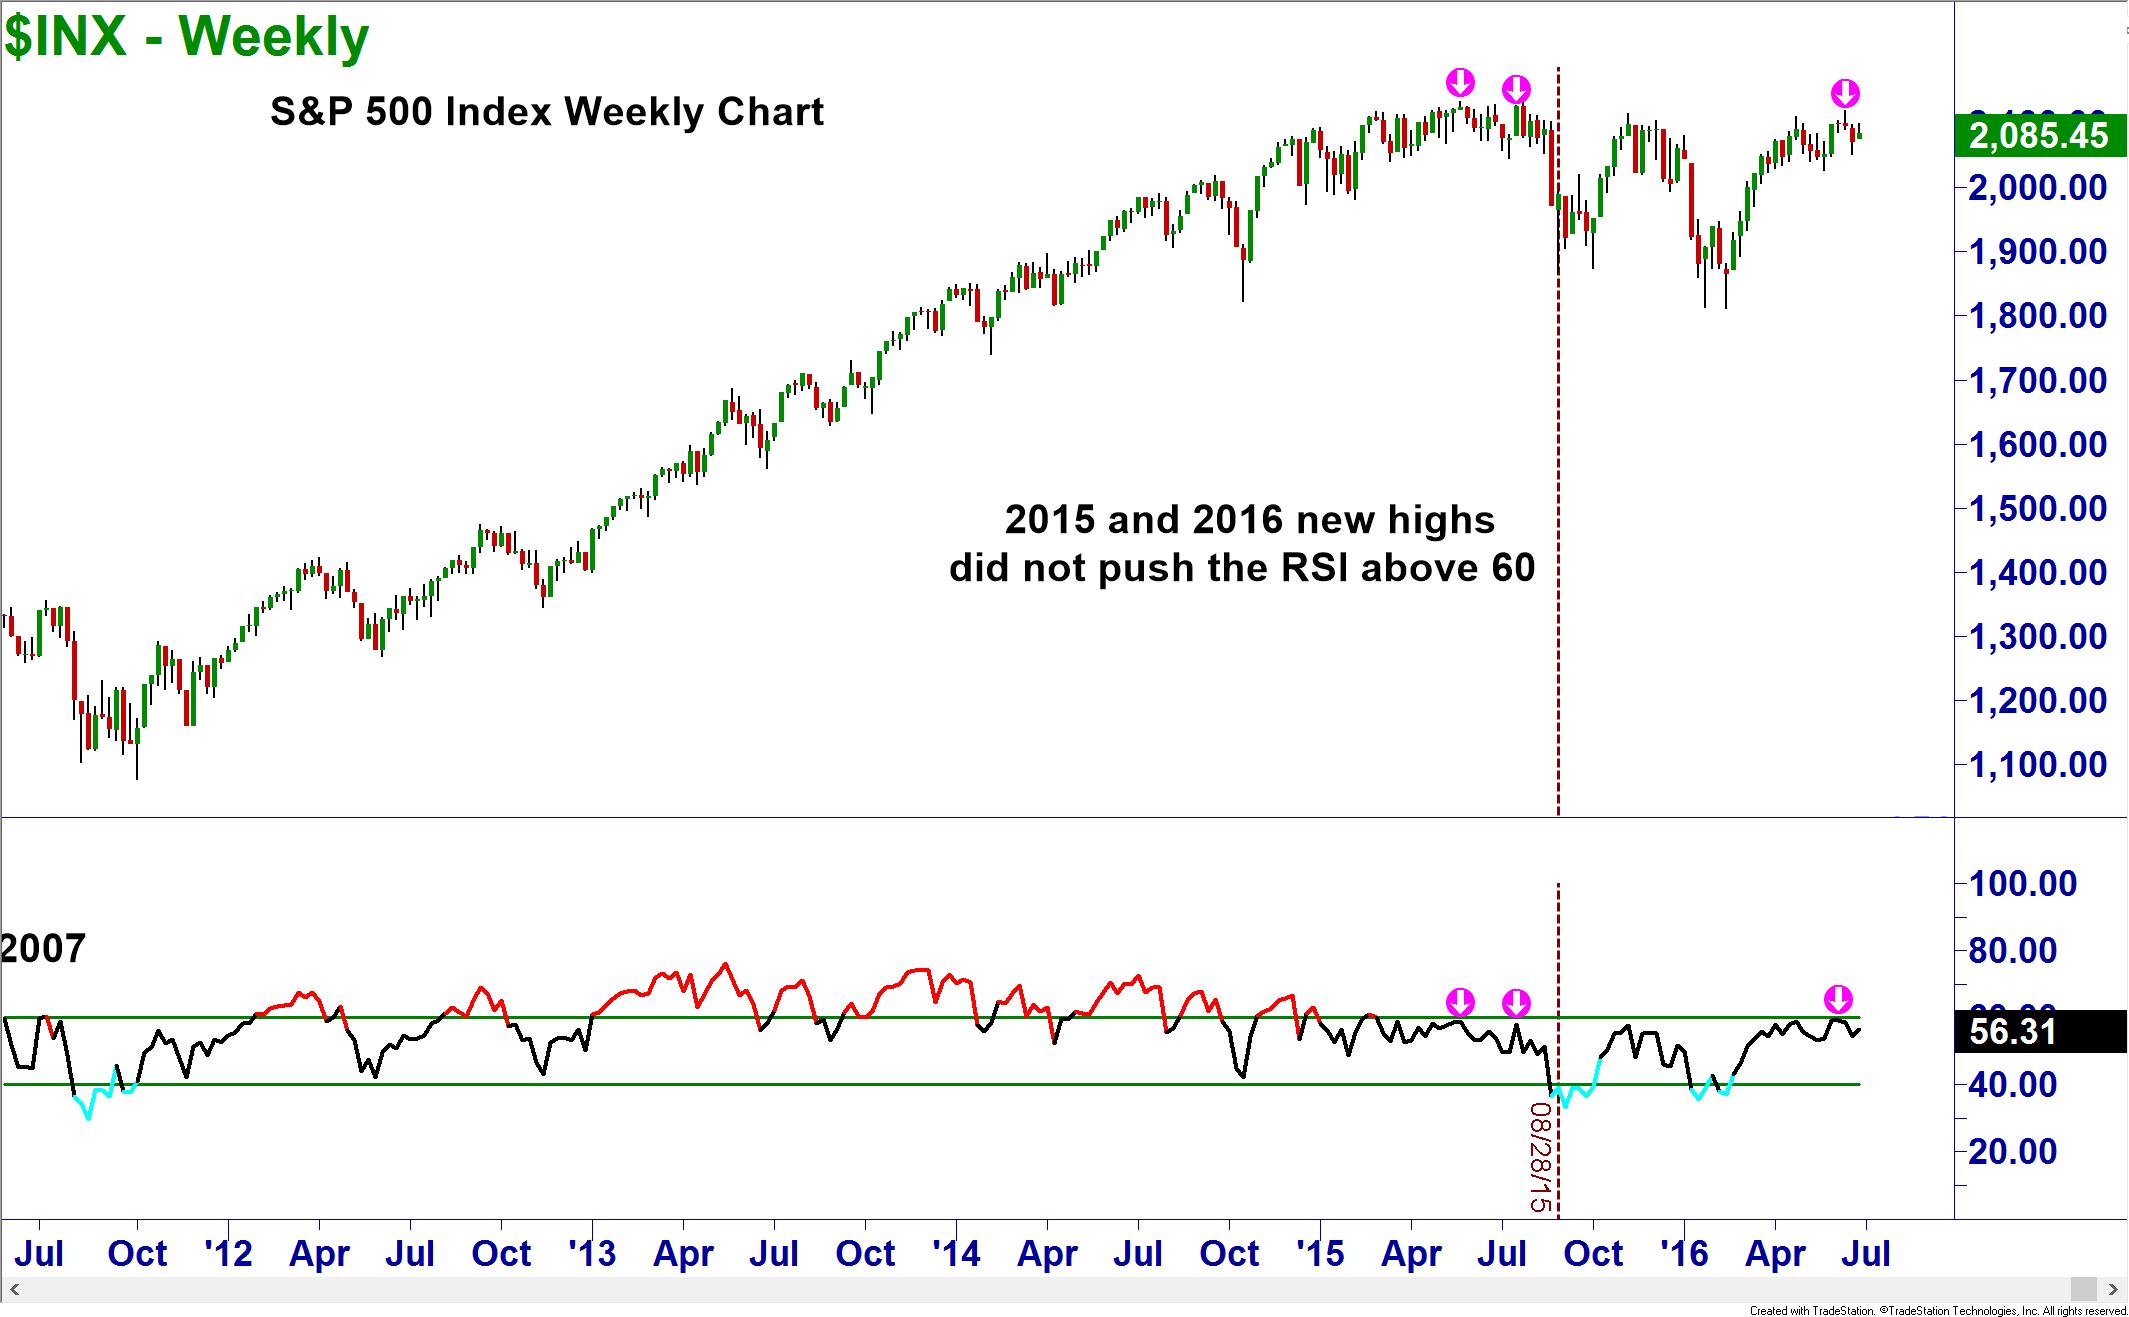
Fig 5
This application of the RSI can be used for any timeframe and any security. I apply it to my intraday charts in futures, forex and stocks as easily as I do for the above weekly charts.
Remember to trade with the trend and use price action for your decisions to enter or exit trades. We can use some indicators to assist our trading but never as the decision maker themselves.
Brandon Wendell can be contacted on this link: Brandon Wendell
As a Chartered Market Technician and member for the Market Technician’s Association, I was required to gain a deep understanding of how most indicators and oscillators work. I was fortunate enough to learn some special tricks for using these indicators so that they work much better than originally intended, in any market!
One such modified indicator is the popular Relative Strength Index (RSI). I want to stress that my entries and exits for trades are triggered by price action and I use a core strategy taught at OTA in my own trading. The indicators I use are simply an odds enhancer or a support tool for decisions made from price action.
Most traders are familiar with the Relative Strength Index or RSI. It is an oscillator that measures the strength of up or down movements in price relative to the stock’s previous price movements. The typical readings for this indicator are 70-30. A reading of 70% means that the stock is overbought and likely to drop soon. The RSI crossing below the 70% line is sometimes taken as a sell signal. Conversely, a reading below 30% shows the stock to be oversold and perhaps ready to rise. A buy signal is said to be generated when the RSI crosses above 30.
The problem with using the RSI in this manner is that in a strong uptrend the RSI will typically use 40 as a support level, meaning that the RSI will not drop below 40 while the trend is intact. Look at the chart of the 2004 to 2007 bull market in the S&P 500 Index weekly chart.

Fig 1
When price is in a strong downtrend, the RSI will use 60 as a resistance level. The RSI will not break above 60 until the trend is breaking. You can see this in the 2008 bear market. All of the rallies failed to move the RSI above 60.

Fig 2
When we are trading in the trend, we want to let our profits run as long as possible and do not want to enter into trades with a low probability of working. Since the RSI uses 60 and 40 as boundaries for trends, the traditional buy and sell signals will not work as you cannot get a buy signal below 30 in a strong bull trend nor will you see a sell signal from a cross below 70. Instead, a use for the RSI would be for determining the trend direction and strength of the trend.
Going back to the weekly chart of the S&P 500, the trend change from bull to bear becomes confirmed once the RSI drops below 40. There were earlier signals that educated traders could have seen but those who waited for the confirmation from the RSI were still able to avoid the pain of the large price drop or even profit from it.

Fig 3
The end of the bear market and start of the bull was ushered in with higher lows and higher highs accompanied by a break above 60 on the RSI.

Fig 4
You are probably wondering what the current market looks like. The bull trend was killed off with lower highs and lower lows in 2015. The RSI also broke below 40 and has been unable to get above 60 even though the index itself has made all-time highs. This does not mean we are in a bear trend, but we are not in a bull one either. 2016 has seen the S&P trading in a sideways channel and time will tell which way it will break. The RSI will tell also.

Fig 5
This application of the RSI can be used for any timeframe and any security. I apply it to my intraday charts in futures, forex and stocks as easily as I do for the above weekly charts.
Remember to trade with the trend and use price action for your decisions to enter or exit trades. We can use some indicators to assist our trading but never as the decision maker themselves.
Brandon Wendell can be contacted on this link: Brandon Wendell
Last edited by a moderator:
