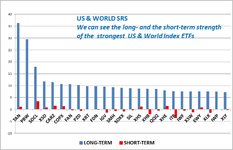
I use a graph like the above to find stocks in the S&P 500 with high Relative Strength.
The blue bars represent the long-term strength of the stocks and the red bars the short-term strength.
I usually choose stocks that show a "good" combination of both long- and short-term strength.
For example, SIG, FDX, RRC, PWR have promising strength, both long- and short-term.
I then look at the chart of these stocks to find additional reasons to buy them.
Finally, I use strict money and risk management. Out safety net when things go wrong!
What do you think about this approach?