Jerry gives us another of his humourous, educated article on chart patterns using the CCI.
We as traders have been looking for the "Holy Grail" for a lifetime. I doubt there is one folks. But all thru my 65 years on this planet I certainly have tried every known indicator, oscillator, etc to get to that Holy Grail. Well I can tell you all I think I found the Holy part of that statement in the momentum indicator the Commodity Channel Index, CCI for short.
Many traders swear by the Macd, Stoch, Rsi, Obv and on and on. The CCI with a 20 moving average (20) is the best leading momentum indicator I have ever used in my trading life. I will include a series of charts depicting the way I use CCI in the exciting world of daytrading which I do for a living. It takes a monumental amount of testing and backtesting anything we traders try for the first time. I learned of this from a spoos (futures) trader in my real time room 4-5 years ago. He showed me in my real time trading room how to use it and how it compares with the other good tools of the trade.
When I say it's a momentum indicator, I mean it shows me heavily overbought and oversold levels on the 5 minute chart I use for scalping/daytrading as the volume on the stock in question confirms this stock has bottomed or topped out. On the indicator there is a Zero Line, plus +100 & +250 lines above the zero line and then minus -100 & -250 below the center line. What this tells me is when the indicator is at extremes at the high +250 or the low -250 we are nearing a capitulation spike in the stocks price and it's getting ready to "reverse". Let's call it an "Alert" to either exit if you are in the trade long or short, or if not in that trade to buy it or short it as the case may be.
Since the March 2003 outside reversal day on huge volume we have actually been in a very nice technical rebound over the last 3 years or so. During this time frame of course we've had our share of corrections. But in all sincerity we have continued to march higher and higher since that all important low. While we are in this rally mode this year I have been buying all dips intraday as the funds continue to pour money in this fire every single month without fail. So for all intents and purposes we can at least see what these charts are telling us as stocks get sold off intraday with force only to rebound surprisingly fast as sellers cease to short or sell, and that pressure relief valve opens up the flood gates of a tradable bounce.
There are very telling signs during the trading day for profitable set ups using this indicator along with volume price and proper entries of that stock. Let me show you actual charts dissecting the anatomy of the trade.
AAPL
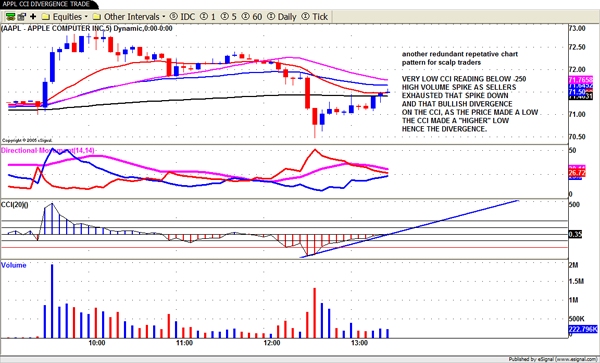
There are several signs of a good trade here on AAPL using the 5 minute time frame. First note that spike down on the CCI to below -250
Next, look at that big spike in volume as the sellers "exhaust" themselves
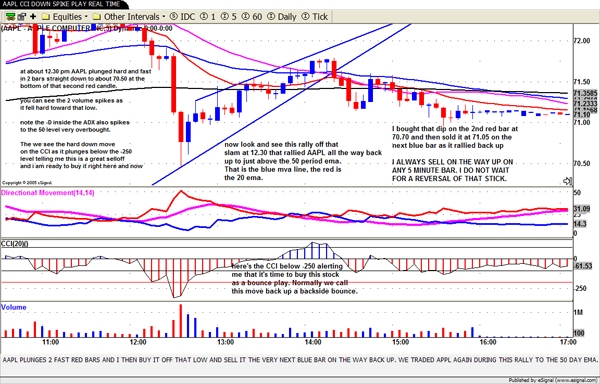
You actually could have bought the 2nd red bar near the lows or the next blue bar for a solid counter trend bounce play.
AAPL
On the very same chart that day after AAPL rallied up nicely off that bullish divergence on the CCI, we see the direct opposite of the earlier chart as the stock is forming a rising wedge high CCI reading at +250
Then it falls out of bed to the downside.
Pretty easy short just below the red 20 ema around 2.30 pm
 c
c
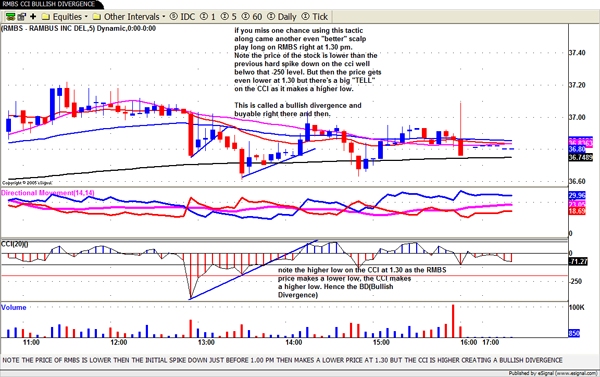
RMBS
On this chart we get a beautiful picture of what I call a "Bullish Divergence" on the CCI.
At 1.30 pm RMBS makes a lower low in price but the CCI makes a higher low, telling me we are slowing in the sellers move down and it's setting up for a long side bounce play.
Bounce it did off the buy point at 38.00 I actually took this trade in the Room
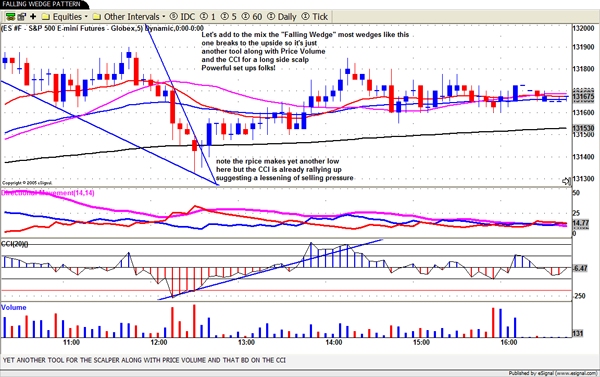
ES M6 chart the E-mini futures
This chart is showing a falling wedge, usually bullish with a spike in volume and a nice set up on the CCI.
That black line in the chart is the 200 ema on the 5 minute chart. The stock was a buy above that line at any time.
When the price of a stock falls below the moving averages we say it is going to do a "backside bounce" up into overhead resistance at those ma's above.
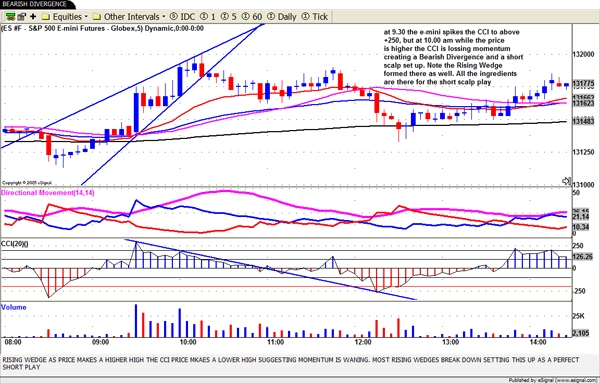
ES M6 rising wedge
Here we see a clear rising wedge pattern which is usually bearish, with a clear bearish divergence on the CCI
As the price makes a higher high the CCI makes a "lower" high signaling a "bearish divergence" on that indicator.
Once the ES broke down thru the up trend line it was a perfect short.
This chart pattern can be used on anything, stocks futures, commodities etc. If you can chart it then you can use it.
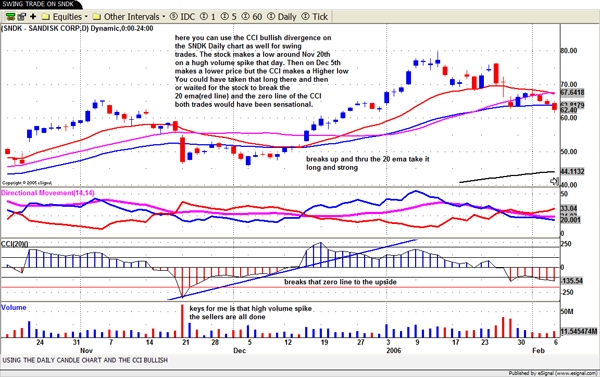
SNDK Daily for Swing Trades
If you go thru your daily routine that I teach in my class, and check out all stocks on their Daily charts first thing everyday, then you're going to catch many solid swing trades.
The buy here was a break over the 20 ema and the break up and thru the Zero Line on the CCI.
That was approximately the 15th of Dec.
NOW check that price then and at the highs of that excellent move.
In closing, I would suggest paper trading these set ups or using small shares till you get the hang of this type of trade. Learn how to draw lines all day long. But most important is the Redundant Repetitive Chart Patterns that I see every single day as I trade. Your morning routine alone can save you a lot of money if you understand what these charts and indicators are telling you. Look first at the daily candle charts for clues to swing long or short. Look for those bullish or bearish divergences on the CCI that can clue you in as to what the proper trade should be. Just remember this please. A consistent winning attitude with some serious chart knowledge can take you a long way. Get into the swing of things each and everyday the very same way when you open the store up for business. Like any great golfer you can depend on that swing under pressure. Same for good traders.
Do not take this Knowledge Lab article lightly, CCI is a wonderful tool and tactic I use successfully every single day I trade, and something I always teach in my online trading classes.
Hope this helps you make a lot of money!
We as traders have been looking for the "Holy Grail" for a lifetime. I doubt there is one folks. But all thru my 65 years on this planet I certainly have tried every known indicator, oscillator, etc to get to that Holy Grail. Well I can tell you all I think I found the Holy part of that statement in the momentum indicator the Commodity Channel Index, CCI for short.
Many traders swear by the Macd, Stoch, Rsi, Obv and on and on. The CCI with a 20 moving average (20) is the best leading momentum indicator I have ever used in my trading life. I will include a series of charts depicting the way I use CCI in the exciting world of daytrading which I do for a living. It takes a monumental amount of testing and backtesting anything we traders try for the first time. I learned of this from a spoos (futures) trader in my real time room 4-5 years ago. He showed me in my real time trading room how to use it and how it compares with the other good tools of the trade.
When I say it's a momentum indicator, I mean it shows me heavily overbought and oversold levels on the 5 minute chart I use for scalping/daytrading as the volume on the stock in question confirms this stock has bottomed or topped out. On the indicator there is a Zero Line, plus +100 & +250 lines above the zero line and then minus -100 & -250 below the center line. What this tells me is when the indicator is at extremes at the high +250 or the low -250 we are nearing a capitulation spike in the stocks price and it's getting ready to "reverse". Let's call it an "Alert" to either exit if you are in the trade long or short, or if not in that trade to buy it or short it as the case may be.
Since the March 2003 outside reversal day on huge volume we have actually been in a very nice technical rebound over the last 3 years or so. During this time frame of course we've had our share of corrections. But in all sincerity we have continued to march higher and higher since that all important low. While we are in this rally mode this year I have been buying all dips intraday as the funds continue to pour money in this fire every single month without fail. So for all intents and purposes we can at least see what these charts are telling us as stocks get sold off intraday with force only to rebound surprisingly fast as sellers cease to short or sell, and that pressure relief valve opens up the flood gates of a tradable bounce.
There are very telling signs during the trading day for profitable set ups using this indicator along with volume price and proper entries of that stock. Let me show you actual charts dissecting the anatomy of the trade.
AAPL
There are several signs of a good trade here on AAPL using the 5 minute time frame. First note that spike down on the CCI to below -250
Next, look at that big spike in volume as the sellers "exhaust" themselves
You actually could have bought the 2nd red bar near the lows or the next blue bar for a solid counter trend bounce play.
AAPL
On the very same chart that day after AAPL rallied up nicely off that bullish divergence on the CCI, we see the direct opposite of the earlier chart as the stock is forming a rising wedge high CCI reading at +250
Then it falls out of bed to the downside.
Pretty easy short just below the red 20 ema around 2.30 pm
RMBS
On this chart we get a beautiful picture of what I call a "Bullish Divergence" on the CCI.
At 1.30 pm RMBS makes a lower low in price but the CCI makes a higher low, telling me we are slowing in the sellers move down and it's setting up for a long side bounce play.
Bounce it did off the buy point at 38.00 I actually took this trade in the Room
ES M6 chart the E-mini futures
This chart is showing a falling wedge, usually bullish with a spike in volume and a nice set up on the CCI.
That black line in the chart is the 200 ema on the 5 minute chart. The stock was a buy above that line at any time.
When the price of a stock falls below the moving averages we say it is going to do a "backside bounce" up into overhead resistance at those ma's above.
ES M6 rising wedge
Here we see a clear rising wedge pattern which is usually bearish, with a clear bearish divergence on the CCI
As the price makes a higher high the CCI makes a "lower" high signaling a "bearish divergence" on that indicator.
Once the ES broke down thru the up trend line it was a perfect short.
This chart pattern can be used on anything, stocks futures, commodities etc. If you can chart it then you can use it.
SNDK Daily for Swing Trades
If you go thru your daily routine that I teach in my class, and check out all stocks on their Daily charts first thing everyday, then you're going to catch many solid swing trades.
The buy here was a break over the 20 ema and the break up and thru the Zero Line on the CCI.
That was approximately the 15th of Dec.
NOW check that price then and at the highs of that excellent move.
In closing, I would suggest paper trading these set ups or using small shares till you get the hang of this type of trade. Learn how to draw lines all day long. But most important is the Redundant Repetitive Chart Patterns that I see every single day as I trade. Your morning routine alone can save you a lot of money if you understand what these charts and indicators are telling you. Look first at the daily candle charts for clues to swing long or short. Look for those bullish or bearish divergences on the CCI that can clue you in as to what the proper trade should be. Just remember this please. A consistent winning attitude with some serious chart knowledge can take you a long way. Get into the swing of things each and everyday the very same way when you open the store up for business. Like any great golfer you can depend on that swing under pressure. Same for good traders.
Do not take this Knowledge Lab article lightly, CCI is a wonderful tool and tactic I use successfully every single day I trade, and something I always teach in my online trading classes.
Hope this helps you make a lot of money!
Last edited by a moderator: