Most traders are glued to indicators and oscillators and that's ok if you use them correctly. The issue is that many traders take each conventional buy and sell signal an indicator or oscillator produces and that can lead to trouble. For those new to trading, the following information should provide a good foundation of an understanding of how to properly use oscillators, if you're going to use them at all.
To illustrate my points, I will use the Commodity Channel Index (CCI). This is certainly not because CCI is my favorite oscillator; I don't use any indicators or oscillators in my trading at all. The goal in trading is to achieve the lowest risk, highest profit margin, and highest probability entry point into a trade. The only way to achieve this is proper market timing. We use our foundation Supply and Demand strategy to time the markets turning points in advance. Today, however, let's add oscillators to the mix as some traders really want a conformation tool and are not comfortable with just price action analysis alone.
First, CCI attempts to measure the variation of a stocks/futures price from its statistical mean. High CCI values suggest that prices are unusually high compared to average prices. Low CCI values suggest that prices are unusually low compared to average prices. The CCI is an oscillator that fluctuates between –100 and +100. Price is considered overbought when CCI moves into +100 territory. Price is considered oversold when CCI moves into –100 territory.
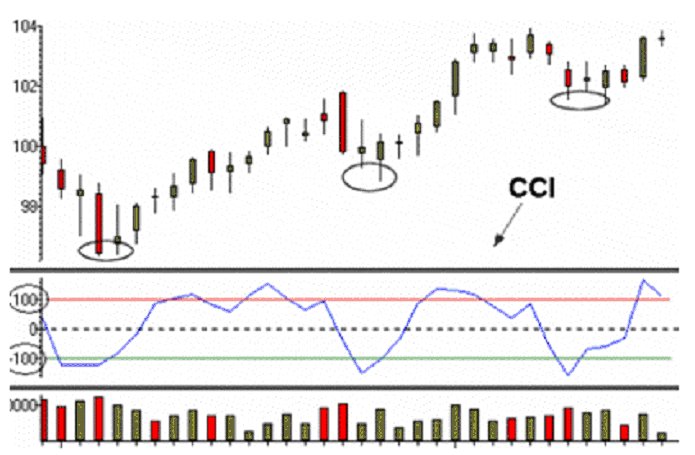
Figure 1
The CCI shows overbought and oversold levels of –100 and +100. CCI extremes correspond to turns in price as seen on the candlestick chart. The turn in price in any market is where a trader obviously wants to buy and sell. However, if trading were as easy as taking these automated buy and sell signals, everyone would be making easy money, but that's not how it works. When using an oscillator like CCI (or RSI, MACD, Stochastics, and so on), it is important to take into account two things we teach and preach: Trends and Support (demand) and Resistance (supply).
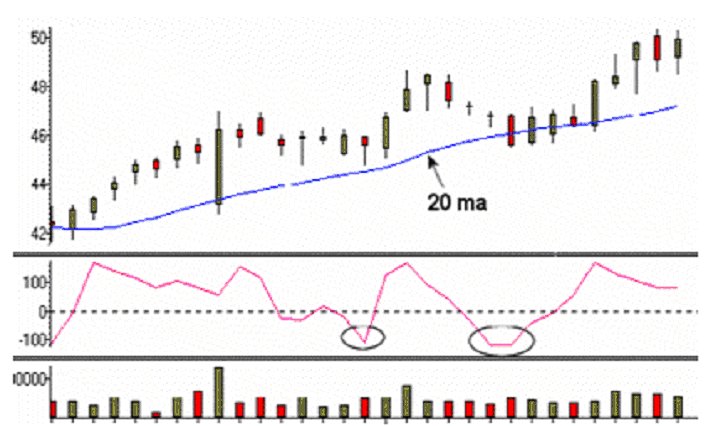
Figure 2
In an uptrend, the ideal use for CCI is to help identify low risk buying opportunities when CCI produces readings of –100 or more. The slope of the 20 ma helps show us the prevailing trend is up. Think about who you are buying from when CCI is oversold in an uptrend; who is the seller? The seller is someone who is selling after a decline in price in the context of an uptrend (a market whose average price is rising). This seller is making two key mistakes that ensure the odds are stacked against them which means they are stacked in our favor as the buyer when CCI produces that oversold reading.
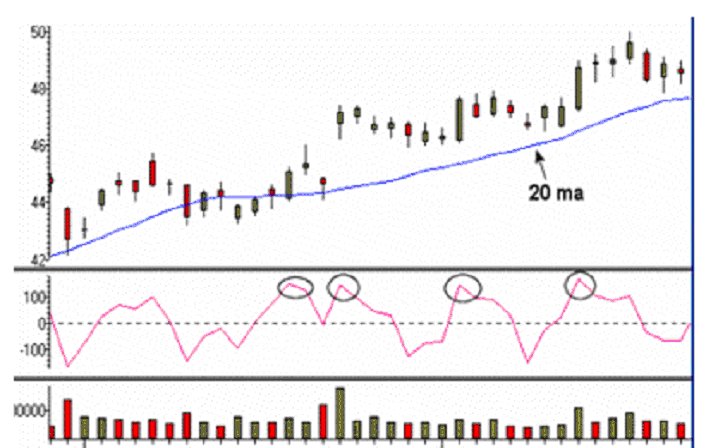
Figure 3
In an uptrend, the CCI can produce readings of +100 or more, but is of little use in identifying tops or potential turning points for a short entry. These readings should be ignored as entry points.
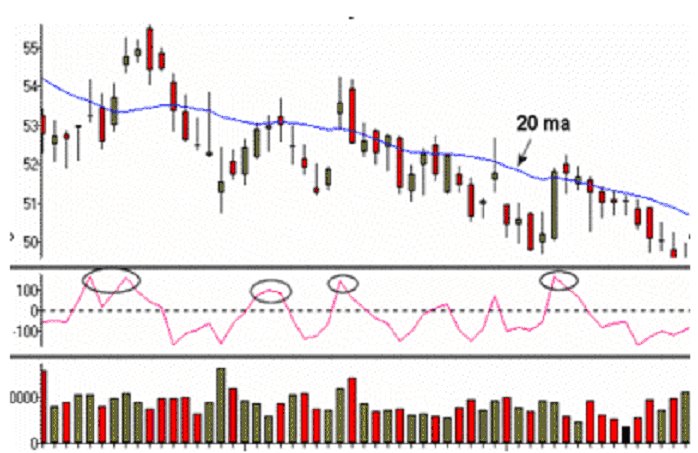
Figure 4
In a downtrend, the ideal use for CCI is to help identify low risk shorting opportunities when CCI produces readings of +100 or more. The slope of 20 ma helps show us the prevailing trend is down. Think about who you are selling to when CCI is overbought in a downtrend; who is the buyer? The buyer is someone who is buying after a rally in price in the context of a downtrend (a market whose average price is falling). This buyer is making two key mistakes that ensure the odds are stacked against them which means they are stacked in our favor as the seller when CCI produces that overbought reading.
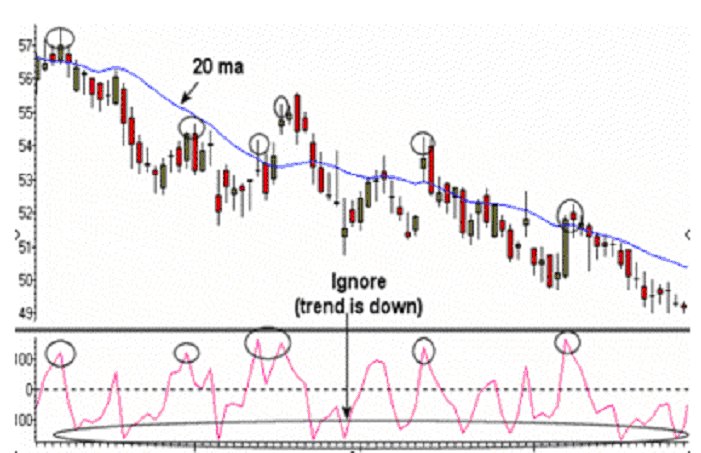
Figure 5
In a downtrend, the CCI extreme readings of +100 or greater lead us to shorting opportunities while we ignore the extreme oversold readings when the trend is down. In a strong downtrend, all the oscillators will remain oversold producing buy signals that can get you into real trouble if you buy when they occur.
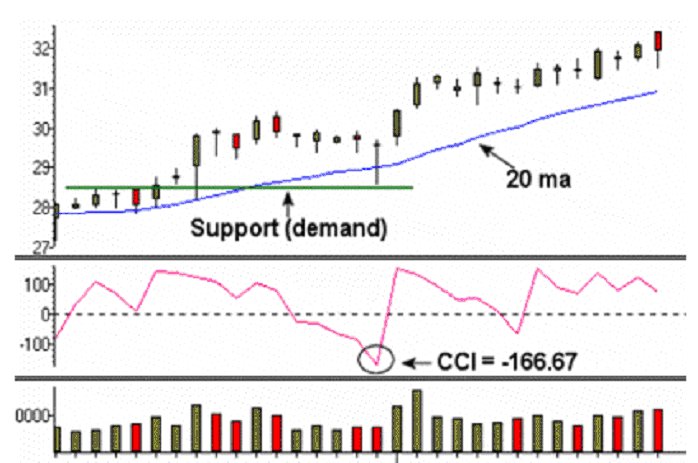
Figure 6
After a breakout, prices had a sharp sell-off into support (demand) which was also the origin of the breakout. This was accompanied by a very extreme CCI reading of –166.67, offering a very low risk / high reward buying opportunity.
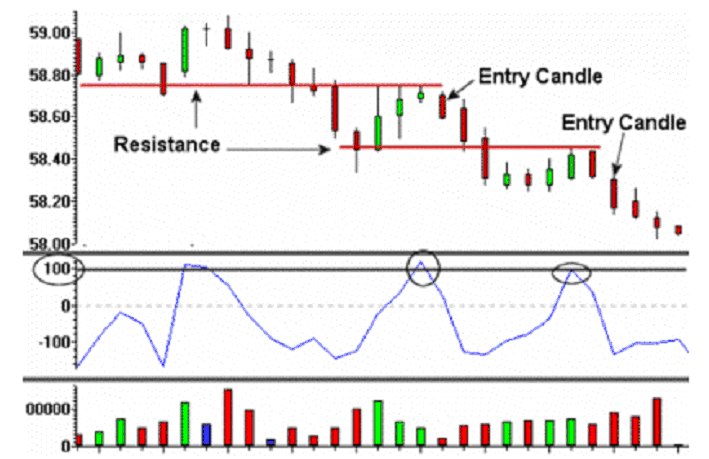
Figure 7
Setup: Rally to resistance within a downtrend.
Odds Enhancer: CCI very overbought.
Action: Sell at resistance (supply) when CCI is overbought. Stop is above the high of the pivot (reversal candle). This is low risk / high reward trading.
Don't ever forget an important component I write about often - understanding who is on the other side of our trade. We use CCI to identify novice buying and selling in the wrong areas and at the wrong times. Proper use of the CCI in conjunction with Trend analysis and Support and Resistance analysis can help stack the odds in your favor when forming a trading decision and trading plan. It also helps take emotion out of trading as it allows us to view objective information at times when trading emotions are tested to the fullest. Keep it nice and simple.
Last edited by a moderator: