GBPUSD results for 2nd March - GBPUSD, EURGBP & EURUSD full week
Yesterday I attached the predicted support and resistance levels of GBPUSD of the Volatility Response Model (VRM) for today.
EURGBP and EURUSD VRM levels were on the website
https://www.complexhamiltoniansystems.com/fxcharts/
There are two attachments
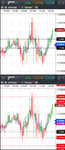
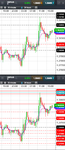
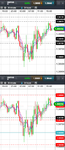
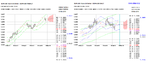
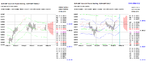
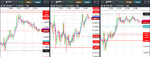
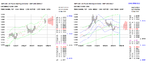
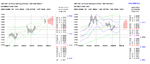
First attachment shows the results for GBPUSD today 2nd March.
Weekly VRM levels in the top 30 minute chart, daily VRM levels in the bottom 30 minute chart. Times are GMT-4 . EMA channel (4,7) included.
GBPUSD stayed amongst the daily sentiment levels. Market could not pull the EMA(4,7) channel down through the daily S1 sentiment level 1.3768
Low for the day was at the daily sentiment level 1.3761
High for the day was at the daily sentiment level 1.3812
There were some large gaps between VRM levels to trade between.
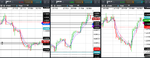
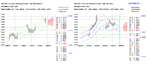
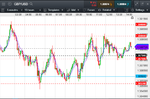
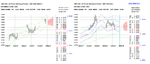
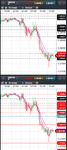
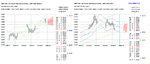
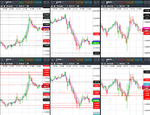
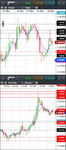
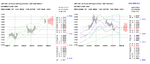
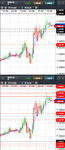
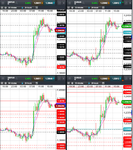
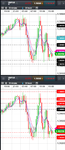
Second attachment shows the 3 hour charts of GBPUSD, EURGBP & EURUSD for the whole week ending today with corresponding weekly VRM levels. Times are GMT-4 . EMA channel (4,7) included.
These charts shows how the three FX pairs coordinate price action about their respective VRM levels. And how long the FX pairs can take to break through a weekly VRM level.
Yesterday I attached the predicted support and resistance levels of GBPUSD of the Volatility Response Model (VRM) for today.
EURGBP and EURUSD VRM levels were on the website
https://www.complexhamiltoniansystems.com/fxcharts/
There are two attachments
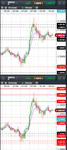
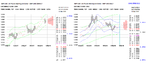
First attachment shows the results for GBPUSD today 2nd March.
Weekly VRM levels in the top 30 minute chart, daily VRM levels in the bottom 30 minute chart. Times are GMT-4 . EMA channel (4,7) included.
GBPUSD stayed amongst the daily sentiment levels. Market could not pull the EMA(4,7) channel down through the daily S1 sentiment level 1.3768
Low for the day was at the daily sentiment level 1.3761
High for the day was at the daily sentiment level 1.3812
There were some large gaps between VRM levels to trade between.
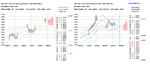
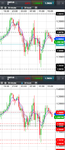
Second attachment shows the 3 hour charts of GBPUSD, EURGBP & EURUSD for the whole week ending today with corresponding weekly VRM levels. Times are GMT-4 . EMA channel (4,7) included.
These charts shows how the three FX pairs coordinate price action about their respective VRM levels. And how long the FX pairs can take to break through a weekly VRM level.