Predicting future FX support and resistance levels using mathematics

GBPUSD predictions for 30th March

I attach the VRM predictions for GBPUSD for tonight and tomorrow finishing 5 pm 30th March in New York.

The predictions are now in chart format and CSV format for input into charting systems. Predictions are in the column format of date, high, low, close, trend channel top, bottom and middle and 24 dual columns for the VRM levels. The last entry gives today's predictions and this week's predictions. The CSV file also gives past results for the VRM for back testing trading strategies. As the current day and week have not finished, the high, low and close entries are set to zero for these dates. The FX chart corresponds to the last daily and weekly CSV file entries.

Documents describing the Volatility Response Model (VRM) and the chart format can be found on the first post of this thread.

Predictions for VRM levels of EURGBP and EURUSD and 10 other FX pairs can be found at

https://www.complexhamiltoniansystems.com/fxcharts/

My current trading strategy is on page #20 post #157 of this thread.
 

Attachments

  • gbpusd.PNG
    gbpusd.PNG
    59.3 KB · Views: 121
  • GBP-USD-DAILY.CSV
    46 KB · Views: 166
  • GBP-USD-WEEKLY.CSV
    46 KB · Views: 129
GBPUSD predictions for 2nd April

I attach the VRM predictions for GBPUSD for tonight and tomorrow finishing 5 pm 2nd April in New York.

The predictions are now in chart format and CSV format for input into charting systems. Predictions are in the column format of date, high, low, close, trend channel top, bottom and middle and 24 dual columns for the VRM levels. The last entry gives today's predictions and this week's predictions. The CSV file also gives past results for the VRM for back testing trading strategies. As the current day and week have not finished, the high, low and close entries are set to zero for these dates. The FX chart corresponds to the last daily and weekly CSV file entries.

Documents describing the Volatility Response Model (VRM) and the chart format can be found on the first post of this thread.

Predictions for VRM levels of EURGBP and EURUSD and 10 other FX pairs can be found at

https://www.complexhamiltoniansystems.com/fxcharts/

My current trading strategy is on page #20 post #157 of this thread.
 

Attachments

  • gbpusd.PNG
    gbpusd.PNG
    59.4 KB · Views: 119
  • GBP-USD-DAILY.CSV
    46 KB · Views: 155
  • GBP-USD-WEEKLY.CSV
    46 KB · Views: 140
GBPUSD, EURGBP & EURUSD results for 2nd April

Yesterday I attached the predicted support and resistance levels of GBPUSD of the Volatility Response Model (VRM) for today.

EURGBP and EURUSD VRM levels and 10 other FX pairs were on the website

https://www.complexhamiltoniansystems.com/fxcharts/

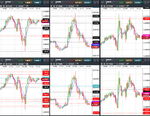
Here are the results for GBPUSD, EURGBP & EURUSD.

Weekly VRM levels in the top 30 minute charts, daily VRM levels in the bottom 30 minute charts. Times are GMT-4 . EMA channel (4,7) included.

Today GBPUSD followed EURUSD to daily highs and then fell to daily lows.

GBPUSD high for the day was determined by the EURUSD high at its weekly sentiment level 1.2345

GBPUSD then fell to its daily S1 sentiment level 1.4032 as EURUSD fell to its daily low at level 1.2287

EURGBP made its daily low at 0.8753 as EURUSD made its daily low.

There were some large gaps between VRM levels to trade between.
 

Attachments

  • 2018-04-02-GBPUSD-EURGBP-EURUSD-30min.png
    2018-04-02-GBPUSD-EURGBP-EURUSD-30min.png
    387.6 KB · Views: 106
GBPUSD predictions for 3rd April

I attach the VRM predictions for GBPUSD for tonight and tomorrow finishing 5 pm 3rd April in New York.

The predictions are now in chart format and CSV format for input into charting systems. Predictions are in the column format of date, high, low, close, trend channel top, bottom and middle and 24 dual columns for the VRM levels. The last entry gives today's predictions and this week's predictions. The CSV file also gives past results for the VRM for back testing trading strategies. As the current day and week have not finished, the high, low and close entries are set to zero for these dates. The FX chart corresponds to the last daily and weekly CSV file entries.

Documents describing the Volatility Response Model (VRM) and the chart format can be found on the first post of this thread.

Predictions for VRM levels of EURGBP and EURUSD and 10 other FX pairs can be found at

https://www.complexhamiltoniansystems.com/fxcharts/

My current trading strategy is on page #20 post #157 of this thread.
 

Attachments

  • GBP-USD-WEEKLY.CSV
    46 KB · Views: 142
  • GBP-USD-DAILY.CSV
    46 KB · Views: 157
  • gbpusd.PNG
    gbpusd.PNG
    59 KB · Views: 139
I attach the VRM predictions for GBPUSD for tonight and tomorrow finishing 5 pm 3rd April in New York.

The predictions are now in chart format and CSV format for input into charting systems. Predictions are in the column format of date, high, low, close, trend channel top, bottom and middle and 24 dual columns for the VRM levels. The last entry gives today's predictions and this week's predictions. The CSV file also gives past results for the VRM for back testing trading strategies. As the current day and week have not finished, the high, low and close entries are set to zero for these dates. The FX chart corresponds to the last daily and weekly CSV file entries.

Documents describing the Volatility Response Model (VRM) and the chart format can be found on the first post of this thread.

Predictions for VRM levels of EURGBP and EURUSD and 10 other FX pairs can be found at

https://www.complexhamiltoniansystems.com/fxcharts/

My current trading strategy is on page #20 post #157 of this thread.

Hey how is your live trading results? What's your average monthly return using this strategy?
 
Hey how is your live trading results? What's your average monthly return using this strategy?

Thank you for your interest in the VRM. I am not a full time trader or even part time as I have another profession. Here in Canada margin requirements are ten times those in the UK so I am unable to make a profession out of FX trading. My trades are intermittent and so my meaningful monthly returns don't exists.

I have provided thread members such as Smart_Money in posts #98, #116 and #119 with GBPUSD data for back testing. I do not have access to intra-day data to carry out back testing. That is something you can do with the right historic data as I provide a CSV file every night of the last 100 intervals.

After all my posts I am very confident that the VRM does calculate future support and resistance levels. The VRM does not say that these levels are where reversals will occur. The VRM does say that the retracements and reversals can occur at these levels. The VRM calculates a scaffolding about which the price action moves. So if you have a trade that is in profit then you can look out for the next VRM level to take your trade to.
 
GBPUSD, EURGBP & EURUSD results for 3rd April

Yesterday I attached the predicted support and resistance levels of GBPUSD of the Volatility Response Model (VRM) for today.

EURGBP and EURUSD VRM levels and 10 other FX pairs were on the website

https://www.complexhamiltoniansystems.com/fxcharts/

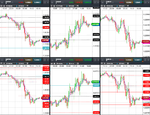
Here are the results for GBPUSD, EURGBP & EURUSD.

Weekly VRM levels in the top 30 minute charts, daily VRM levels in the bottom 30 minute charts. Times are GMT-4 . EMA channel (4,7) included.

Today it was the turn of EURUSD to follow GBPUSD to the daily high.

The GBPUSD made its high at the weekly sentiment level 1.4083 which was also the middle of the short term trend channel 1.4082 within a pip.

EURUSD followed GBPUSD down from there.

GBPUSD low for the day was at the lowest daily sentiment level 1.4027

EURGBP high for the day was at its daily S1 sentiment level 0.8763 and its low was at level 0.8717

There were some large gaps between VRM levels to trade between.
 

Attachments

  • 2018-04-03-GBPUSD-EURGBP-EURUSD-30min.png
    2018-04-03-GBPUSD-EURGBP-EURUSD-30min.png
    408.1 KB · Views: 111
GBPUSD predictions for 4th April

I attach the VRM predictions for GBPUSD for tonight and tomorrow finishing 5 pm 4th April in New York.

The predictions are now in chart format and CSV format for input into charting systems. Predictions are in the column format of date, high, low, close, trend channel top, bottom and middle and 24 dual columns for the VRM levels. The last entry gives today's predictions and this week's predictions. The CSV file also gives past results for the VRM for back testing trading strategies. As the current day and week have not finished, the high, low and close entries are set to zero for these dates. The FX chart corresponds to the last daily and weekly CSV file entries.

Documents describing the Volatility Response Model (VRM) and the chart format can be found on the first post of this thread.

Predictions for VRM levels of EURGBP and EURUSD and 10 other FX pairs can be found at

https://www.complexhamiltoniansystems.com/fxcharts/

My current trading strategy is on page #20 post #157 of this thread.
 

Attachments

  • gbpusd.PNG
    gbpusd.PNG
    58.7 KB · Views: 123
  • GBP-USD-DAILY.CSV
    46 KB · Views: 149
  • GBP-USD-WEEKLY.CSV
    46 KB · Views: 145
GBPUSD 5 minute chart today so far

I attach the current 5 minute chart for GBPUSD. Weekly VRM levels in the top 5 minute chart, daily VRM levels in the bottom 5 minute chart. Times are GMT-4 . EMA channel (4,7) included.

Note the bounce off weekly sentiment level 1.4015. Then follow the EMA channel up to daily sentiment level 1.4071 where there is retracement back to the daily S1 sentiment level 1.4063 then back on upwards to the short term trend channel middle 1.4082. So anyone wondering why its spent the nearly the last 3 hours at this level....the GBPUSD is trying to become short term trend bullish and has failed so far.
 

Attachments

  • 2018-04-04-GBPUSD-5min-1340-GMT-4.png
    2018-04-04-GBPUSD-5min-1340-GMT-4.png
    106.6 KB · Views: 114
GBPUSD, EURGBP & EURUSD results for 4th April

Yesterday I attached the predicted support and resistance levels of GBPUSD of the Volatility Response Model (VRM) for today.

EURGBP and EURUSD VRM levels and 10 other FX pairs were on the website

https://www.complexhamiltoniansystems.com/fxcharts/

Here are the results for GBPUSD, EURGBP & EURUSD.

Weekly VRM levels in the top 30 minute charts, daily VRM levels in the bottom 30 minute charts. Times are GMT-4 . EMA channel (4,7) included.

See my comments in the last post made today intra-day with a 5 minute chart attached.


There were some large gaps between VRM levels to trade between.
 

Attachments

  • 2018-04-04-GBPUSD-EURGBP-EURUSD-30min.png
    2018-04-04-GBPUSD-EURGBP-EURUSD-30min.png
    360.9 KB · Views: 141
GBPUSD predictions for 5th April

I attach the VRM predictions for GBPUSD for tonight and tomorrow finishing 5 pm 5th April in New York.

The predictions are now in chart format and CSV format for input into charting systems. Predictions are in the column format of date, high, low, close, trend channel top, bottom and middle and 24 dual columns for the VRM levels. The last entry gives today's predictions and this week's predictions. The CSV file also gives past results for the VRM for back testing trading strategies. As the current day and week have not finished, the high, low and close entries are set to zero for these dates. The FX chart corresponds to the last daily and weekly CSV file entries.

Documents describing the Volatility Response Model (VRM) and the chart format can be found on the first post of this thread.

Predictions for VRM levels of EURGBP and EURUSD and 10 other FX pairs can be found at

https://www.complexhamiltoniansystems.com/fxcharts/

My current trading strategy is on page #20 post #157 of this thread.
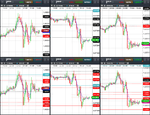
 

Attachments

  • gbpusd.PNG
    gbpusd.PNG
    58.6 KB · Views: 125
  • GBP-USD-DAILY.CSV
    46 KB · Views: 142
  • GBP-USD-WEEKLY.CSV
    46 KB · Views: 170
GBPUSD, EURGBP & EURUSD results for 5th April

Yesterday I attached the predicted support and resistance levels of GBPUSD of the Volatility Response Model (VRM) for today.

EURGBP and EURUSD VRM levels and 10 other FX pairs were on the website

https://www.complexhamiltoniansystems.com/fxcharts/

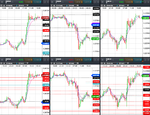
Here are the results for GBPUSD, EURGBP & EURUSD.

Weekly VRM levels in the top 30 minute charts, daily VRM levels in the bottom 30 minute charts. Times are GMT-4 . EMA channel (4,7) included.

GBPUSD high for the day was determined by the EURUSD high for its day at its daily S1 sentiment level 1.2290.

EURUSD price action was controlled by its daily VRM levels with not a single weekly VRM level in sight.

The GBPUSD fell with the EURUSD to its low at daily level VRM level 1.3984 as EURUSD fell to its daily low at level 1.2226

There were some large gaps between VRM levels to trade between.
 

Attachments

  • 2018-04-05-GBPUSD-EURGBP-EURUSD-30min.png
    2018-04-05-GBPUSD-EURGBP-EURUSD-30min.png
    386.1 KB · Views: 138
GBPUSD predictions for 6th April

I attach the VRM predictions for GBPUSD for tonight and tomorrow finishing 5 pm 6th April in New York.

The predictions are now in chart format and CSV format for input into charting systems. Predictions are in the column format of date, high, low, close, trend channel top, bottom and middle and 24 dual columns for the VRM levels. The last entry gives today's predictions and this week's predictions. The CSV file also gives past results for the VRM for back testing trading strategies. As the current day and week have not finished, the high, low and close entries are set to zero for these dates. The FX chart corresponds to the last daily and weekly CSV file entries.

Documents describing the Volatility Response Model (VRM) and the chart format can be found on the first post of this thread.

Predictions for VRM levels of EURGBP and EURUSD and 10 other FX pairs can be found at

https://www.complexhamiltoniansystems.com/fxcharts/

My current trading strategy is on page #20 post #157 of this thread.
 

Attachments

  • GBP-USD-WEEKLY.CSV
    46 KB · Views: 174
  • GBP-USD-DAILY.CSV
    46 KB · Views: 159
  • gbpusd.PNG
    gbpusd.PNG
    59 KB · Views: 109
Hi gka
Can you test Predicting with neural nets?

Thank you for your testing suggestion of the VRM algorithm. The neural networks I am familiar with have outputs of 0 or 1 to recognise pattern as NO or YES. So at the moment I am not sure how the VRM levels could be converted into logic decisions. I will think about it.
 
GBPUSD inter-day chart - Non Farm Payroll day

Today is non farm payroll day so I attach the 5 minute price action chart from 9:00 (GMT-4). The non-farm payroll results happened at 9:30 my time.

Weekly VRM levels in the top 5 minute charts, daily VRM levels in the bottom 5 minute charts. Times are GMT-4 . EMA channel (4,7) included.

I am using the 5 minute charts to trade as per my trading strategy on page #20 post #157 of this thread.

The GBPUSD was always a buy from 9:10 (GMT-4) up to level 1.4094. On the announcement of the NFP the volatility drove the price back down to the daily S1 sentiment level 1.4006 where the market bought again. There was retracement at the level 1.4073. But the market finally reached level 1.4094. The market is now trapped between levels 1.4094 and 1.4082.
 

Attachments

  • 2018-04-06-GBPUSD-5min-1240-GMT-4.png
    2018-04-06-GBPUSD-5min-1240-GMT-4.png
    95 KB · Views: 115
Last edited:
GBPUSD, EURGBP & EURUSD results for 6th April - US Non farm Payroll

Yesterday I attached the predicted support and resistance levels of GBPUSD of the Volatility Response Model (VRM) for today. US Non farm Payroll day.

EURGBP and EURUSD VRM levels and 10 other FX pairs were on the website

https://www.complexhamiltoniansystems.com/fxcharts/

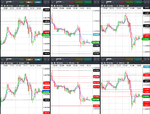
Here are the results for GBPUSD, EURGBP & EURUSD.

Weekly VRM levels in the top 30 minute charts, daily VRM levels in the bottom 30 minute charts. Times are GMT-4 . EMA channel (4,7) included.

GBPUSD low for the day was at the lowest daily sentiment level 1.3985.

GBPUSD high for the day was at level 1.4094.

See my last post with a 5 minute chart to show the GBPUSD price action in more detail.

There were some large gaps between VRM levels to trade between.
 

Attachments

  • 2018-04-06-GBPUSD-EURGBP-EURUSD-30min.png
    2018-04-06-GBPUSD-EURGBP-EURUSD-30min.png
    321.1 KB · Views: 111
Prediction...

Not trying to barge in on the thread.. but the mathematical approach to the market is a failure from the start. The market is driven by volumes, something institutions have kept to themselves for the most part since it's infancy. But.. aggregation of volumes with intelligent filtering and studies of price action inside the remaining data gives you proper volume analysis where the bid/offer range is important.. But predictions are a failure if mathematically approached. Here is today's Pre Non Farm Release and expected high/low targets.. None of which was mathematically derived and all dependent upon volume which if studied is psychologically derived and triggered either through manually traded levels or algorithmically approached strategies...

Here's pre news.. chart and post news chart.. 3 moves all within 3 pips
 

Attachments

  • today111.JPG
    today111.JPG
    150.5 KB · Views: 119
  • Screen Shot 2018-04-06 at 4.37.05 PM.png
    Screen Shot 2018-04-06 at 4.37.05 PM.png
    177.1 KB · Views: 140
Not trying to barge in on the thread.. but the mathematical approach to the market is a failure from the start. The market is driven by volumes, something institutions have kept to themselves for the most part since it's infancy. But.. aggregation of volumes with intelligent filtering and studies of price action inside the remaining data gives you proper volume analysis where the bid/offer range is important.. But predictions are a failure if mathematically approached. Here is today's Pre Non Farm Release and expected high/low targets.. None of which was mathematically derived and all dependent upon volume which if studied is psychologically derived and triggered either through manually traded levels or algorithmically approached strategies...

Here's pre news.. chart and post news chart.. 3 moves all within 3 pips

Thank you for your view of trading using volume data. Where do you get aggregation of volume data to carry our your calculations? Do the major banks share the volumes of their trades?

I attach the VRM predictions for EURUSD today as comparison.

The high for EURUSD today I have as 1.22912. The VRM gave HI level 1.2298

The low for EURUSD today I have as 1.22148. The VRM gave L1 level as 1.2213
 

Attachments

  • eurusd.PNG
    eurusd.PNG
    57.7 KB · Views: 120
data

Thank you for your view of trading using volume data. Where do you get aggregation of volume data to carry our your calculations? Do the major banks share the volumes of their trades?

I attach the VRM predictions for EURUSD today as comparison.

The high for EURUSD today I have as 1.22912. The VRM gave HI level 1.2298

The low for EURUSD today I have as 1.22148. The VRM gave L1 level as 1.2213

I built the data.
 
hi gka, you clearly have an impressive level of maths modeling and programming ability here im sure there could be a way forward for you in trading if thats what you want to do. im not sure you are gonna achieve much by sharing the "VRM" levels on here though, i think they will effectively be meaningless to anyone other than you to be frank. what would perhaps be a more constructive use of your time would be to build on your strengths and focus on writing and testing robots/EAs/algorithms for doing the trading. just some feedback.
kind regards
kso
 
Top