Best Thread Potential setups

Status
Not open for further replies.
Gbpusd

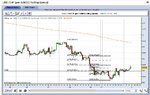
The chart below is what I'm see-ing currently on 1hr cable re: areas of previous near term supply/demand / demand/supply imbalances (of varying potential for future near term supp/res,) fibs and t/lines for detremining entries on t/f's below the 1hr.

G/L

fxq7vo.gif
 
Anyone like the Bobl?

It's retracing back up right now so I will be watching it.
 

Attachments

  • Euro Bobl Future weekly.png
    Euro Bobl Future weekly.png
    20.2 KB · Views: 140
  • Euro Bobl Future Daily.png
    Euro Bobl Future Daily.png
    20.9 KB · Views: 140
Gbpusd

I always chuckle when the newsfeed decsribes price action as '...nice 2 way action in the pairing...' lol. This is what we have in cable so far this morning with price breaking down to the 2nd purple zone from top shown in post #7496 before finding resistance at the 1st from top (sbr) and then support again deeper in the first mentioned.
 
HH in the 1hr, lets see if we get a LH for a confirmation of an uptrend/retracement.

Are you sure about your fibs? I would draw it from the high of May 27..

Well, Im not that sure about anything :) but I previously had the one from May 28 in as well, which does actually show some confluence. I probably took it off as it was looking a bit cluttered.

My sentiment was, if anything, bearish at this point, but it seems to have found support at 1.0696. Still not totally convinced, so just watching.
 

Attachments

  • USD-CHF-1H-20090602-0901.jpg
    USD-CHF-1H-20090602-0901.jpg
    96.7 KB · Views: 152
Same here.. I`m long from 1.08487..

Vinicius and Tom,

Would either of you guys mind explaining your entry? I hope it's legitimate to ask, as I was also considering this, but had my mind more on the Swissie yesterday.

Were either/both of you playing it on the daily pin, or some other criteria?
I guess I was thinking of a more conservative entry after a break high of the pin (high of 1.0947 on my chart).

Thanks,
Mike
 
Last edited:
gbpusd

Zone a or b is where the local resistance/support is atm in this pairing, (1hr chart).. Nice bounces and set-us in the zones on lower t/f's so far. One of them will give way, hidden divergence building on the 1hr chart has to fail for a deeper pullback.

2nhlwrl.gif
 
EUR/USD is cooking something..

1hr IB, nice daily pin coming from 50% fib. The price retraced and it has found support at 1.41at the last LH!

If breaks down we may see a nice retracement to 1.34(?) if the support holds the price we may see 1.43 and then we`ll be ready for the move down..

Note: Out of my short and going long now..
 
Last edited:
Vinicius and Tom,

Would either of you guys mind explaining your entry? I hope it's legitimate to ask, as I was also considering this, but had my mind more on the Swissie yesterday.

Were either/both of you playing it on the daily pin, or some other criteria?
I guess I was thinking of a more conservative entry after a break high of the pin (high of 1.0947 on my chart).

Thanks,
Mike

I dont know about Tom, but I`m playing the weekly level of support. It is really strong and the price has great chances of reaction at this levels, IMO is not a reversal, not yet at least, just a pull back... it needs a retracement to continue the move down and I got in at the break of the 4hr pin and bought some more below that level..
 
Possible long USD/CAD...yesterday daily pinbar developed, touching a long term support line from May 2007 and August 2008.

Possible eurozone interest rate lowering could strengthen the dollar.
 
Hey Montmorency,

Yes, it came into a big daily level that was a previous high on 11th September 2008. It broke below it and then rebounded and stabilised above. I took a 1hr inside candle long...

Give me a sec I'll post a chart.
 
Usd/Cad Trade Walk through *Part 1*

This is the area I was watching on the daily chart.

If a reveral was going to happen, this was the high probability area.
 

Attachments

  • usdcad1.gif
    usdcad1.gif
    23.9 KB · Views: 241
Usd/Cad Trade Walk through *Part 2*

The second chart shows my first potential target - the area of lows (previous support) on the far left of the chart.
 

Attachments

  • usdcad2.gif
    usdcad2.gif
    28 KB · Views: 221
Usd/Cad Trade Walk through *Part 3*

Note how the market came and closed below this level on the hourly.

Then it rallied back above.

Then it has another go but fails to make a new low.

The market pushes up once more and makes a new high.

Finally, we have one more push down resulting in an inside candle with the close well off the low of that period.

It was at this point that I took my position. (see arrow and green price marker indicating price I was filled at).

I closed out 1/2 just ahead of the first target (1st red price marker). (+75 pips)

I got the exact high (fortunately) which was then followed by a pullback overnight before we had another go this morning.

At this point, I moved my stop on the second half to the low of the candle that closed through the target level. I was then stopped out for +57 pips.

+ note: I am fully aware that there was a daily pin but as I have said before - I exit on the timeframe I enter on. I entered on the hourly and I chose to exit on that. +
 

Attachments

  • usdcad3.gif
    usdcad3.gif
    22.1 KB · Views: 234
Last edited:
Status
Not open for further replies.
Top