Post a chart!

ffsear

Guest Author
Messages
2,304
Likes
551
Post a chart your watching.

Any market

A thread to discuss your current ideas with other members, Not a thread for live calls, Just Technical Analysis. This is a thread for setups you are watching and waiting for. Or trades you are in.

NO DISCUSSING MONEY MANAGEMENT, LEVERAGE, RISK REWARD, ETC ETC.

This thread is just for chart setups

SUPPORTS AND RESISTANCE......TRENDLINES.........PRICE ACTION

What are you watching?
 
Last edited:
Brent Crude June 14 looks interesting. 109 area looks key. A restest of that area with a decent price action conformation could look good for a long. If 109 fails, then the lowwer treand line will be next level to watch.

174648d1400014060-post-chart-2014-5-13_lcg-254240-1-.png
 

Attachments

  • 2014-5-13_LCG-254240 (1).png
    2014-5-13_LCG-254240 (1).png
    44.2 KB · Views: 1,567
Last edited:
Looked at a GBP/CAD short here. 10 point spread on Capital Spreads put me off though.
 

Attachments

  • cad.jpg
    cad.jpg
    120.6 KB · Views: 396
Last edited:
One I'm watching to continue its rise. GPOR Bought at 600 on the (P&F) triple top breakout, coincinding with breaks of an all time high. Legs to go much further hopefully

174654d1400014978-post-chart-gpor.jpg
 

Attachments

  • GPOR.JPG
    GPOR.JPG
    341.4 KB · Views: 1,600
Last edited by a moderator:
and one I'm watching..GEMD doesn't take a genius to see why..
 

Attachments

  • GEMD.JPG
    GEMD.JPG
    73.2 KB · Views: 301
and one I'm watching..GEMD doesn't take a genius to see why..

Im no genius, i see 18 as key. Do u have a bias at that level? Nice up trend., Are you bullish, or would you take a short at 18 with good PA? or leave alone?
 
Im no genius, i see 18 as key. Do u have a bias at that level? Nice up trend., Are you bullish, or would you take a short at 18 with good PA? or leave alone?

sorry mate, yes I've highlighted the area i would be looking to buy GEMD. confirmation of the trend reversal. Technically a H&S is taking place, but with resistance right above a close above 18ish would be a buy signal for me.
 
Nice idea, ffsear

Waiting to add some more on HL @ around 1255

hluksbdaily.png

hluksbh1.png
 
Daily chart this one..

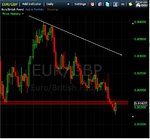
EUR/GBP recent break of earlier low this year. Now its retraced and retesting.

Breakout or Fakeout?

edit. Taken a sell at .8156. Sl .8179 - above yesterdays high.
 

Attachments

  • eur.jpg
    eur.jpg
    75.9 KB · Views: 256
Last edited:
GBP/NZD Testing previous weeks low. If you zoom out the chart this level has also been significant before. Also appears to be right on the 61 fib. Would like to see some hefty price action here.
 

Attachments

  • 2014-5-14_LCG-228565 (3).png
    2014-5-14_LCG-228565 (3).png
    51 KB · Views: 250
Last edited:
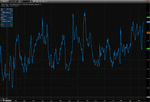
here is a daily line chart of one of my candidate spreads showing the last 15 months. I have placed dotted green lines 2 SDs away from the orange dotted mean just for visual reference. The plot is a plain ratio (no Beta weighting) TROX / KALU. TROX produces and markets titanium products and KALU produces aluminium products.
 

Attachments

  • TROXKALU.png
    TROXKALU.png
    84.7 KB · Views: 267
Nice idea, ffsear

Waiting to add some more on HL @ around 1255

Added the third lot virtually smack on day's high :LOL:. Cleared the lot on the purple for tiny profit overall.
 

Attachments

  • hluksbh1.png
    hluksbh1.png
    15.2 KB · Views: 232
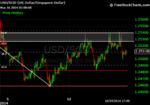
Have been short USD/SGD @ 1.2526 across the weekend. Hoping for a lower open. SL at BE
 

Attachments

  • sgd.png
    sgd.png
    25.3 KB · Views: 250
Top