N Rothschild
Legendary member
- Messages
- 5,296
- Likes
- 603
according to who? i fail to see how you can use indicator readings from nearly a year apart
Today the EUR broke important resistance, time to head towards 1.43.
Bbmac: What timeframes do you tend to trade on?
Cheers,
Mike
So it's the underlying index that has had the weightings change; equity funds that aren't allowed to take on relative FX positions beyond those stipulated in the index have to "rebalance"(?) in order to keep to the agreements with the investors / the funds prospectus... they don't do it day by day because it is just too much effort and would cost too much in transaction fees - but some don't have to do it all immediately either, they are allowed a little room to breathe to get the trades off at the best prices they can, rather than dumping it all in one series of trades come the deadline no matter what.
Warmer?
I was long Eur/Gbp from 0.8730.
Scaled out 1/3 at 0.8761.
Another 1/3 at 0.8779.
Final 1/3 at 0.8795.


1. This long trade was only ever short term for you due to the descending triangle above.
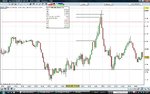
2. Because you had this in mind you were fine tuning exits at resistances based on 10 or 15min time frames, as chart below.
3. If the trade was in the direction of the daily trend you my have been happier to exit on the same time frame as your entry, or a little lower.
If this is in any way correct, would this transfer to a daily entry with say 4h to an hourly exit?
Chart below is 5min, price has channelled off the current intraday hi (6429) and trades between that and 6370/75 area which is 23.6% of the intraday move up and Dly R1 pivot. Would be interested in buying/selling a thrust candle breakout or failing that a less convincing breakout followed by a pullback to the channel and a 2nd b/o with the channel acting as sbr/rbs.

The Cable 1hr pin was followed by two inside candles...if this was at any kind of s/r pivot I would be all over it...but since it's not, I wouldn't be surprised to see Cable do what it does best...trigger the shorts and then nail it to the upside 🙂
Having said that, it's a great R:R for any of you that simply have to trade 😉 The nearest s/r pivot I have to the downside is around 1.6065 providing an excellent r:r.
Just not high probability enough for me.
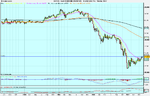
Lol your comments re cable, exactly what happened. There is a Daily prev swing hi zone there as pointed out in previous posts and Mni were bigging up the 38.2% of the 1162-3505 swing down at 6430 which was strange as I have it around 6410. (Good reversal set-ups on the first test of 6430 to 15min chart, but price has since rallyed to a new high in that prev daily sw hi zone off 63450/50 area and above even MNi's reading of that 38.2%fib.