The REAL Potential setups thread...

Yuppie

Well-known member
Messages
283
Likes
48
Hello folks,

Thought I would start a thread to totally plagiarise TD's Potential Setups thread. The Potential Setups thread is great; I read it every day. However, I thought I saw a niche for a more distilled version.

I was going to call this thread 'Trades to bet the house on...', but figured the title I gave it would garner more attention.

This thread, as with most threads started by members who are not well-known on the boards, will probably disappear into the ether of other, newer threads - but I think it's worth a shot.

Mission statement of this thread:

To highlight high-probability potential trades for others to observe, analyse and learn from.


I have what I think is a good format for this thread to take. However, it's totally open for consideration for the benefit of the masses. I propose this when posting a potential trade:


- Provide a strategy(s) on how you would [like to] play the particular trade; entry, exit, sizing, etc.

- Post a follow-up on the setup; i.e. did it follow-through, fail, was it aborted, etc.

- Give the setup a number relative to the thread to make looking back easier; i.e. find the number of the last setup posted, say "Setup #23", and post your one as "Setup #24"


Like I said, this thread will no doubt disappear into the black-hole that is T2W Day Trading & Forex Forums > General Forums > General Trading Chat, but you never know.

This thread is for everyone and so all comments/thoughts/criticisms are welcomed, nay, expected.


Magnus
 
I'm bit bored of all the hindsight analysis of potential setups instead of actually displaying potential setups!

Further more I'm tired of seeing the same setup posted 3 times in a row when it's already too late.

I really hope this thread takes off, i've subscribed and will post some charts when I have time.

Hopefully this will turn out into a more popular version of Just Charts No Chat [ The best forum of T2W which includes trading ].

As for Setup numbers, It's easy to just link the setup to the topleft of the posted message. i.e this would be... Setup 2 with this link (click on permalink then copy and paste from the address bar) Here.

It'd be quite nice to have template posted at the start so every post is in the same format and it's easy to skim through and the writer just has to post a chart.

Good trading.
 
Setup #1 - GBP/JPY

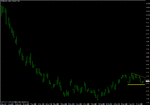
Right, to get the ball rolling, I propose [at short notice] Setup #1.


GBP/JPY

- 141.50 is S/R area
- 50.0% Fib area
- 61.8% Fib area
- May coincide with trendline


Looking for a bullish candle formation to confirm a LONG entry (Pinbar or Bullish-engulfing).

The chart is 4-hour. However, would be fairly comfortable taking this off 1-hour if the price-action was confirming.

I'd be looking to enter with two lots. Exit first lot when approaching first sign of resistance. Second lot would be trailed behind Support areas as price moved up through.


Magnus
 

Attachments

  • 20-04-2009_gbpjpy_setup_1.gif
    20-04-2009_gbpjpy_setup_1.gif
    23.2 KB · Views: 403
set-Up # 2 gbpusd

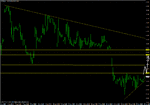
I'd be looking for a set-up short on the lower time frames with a good price action trigger at any of the coloured zones, perferably with trend line and/or fib confluence on 1hr gbpusd chart below. The first purple zone up from the bottom is a previous sing lo zone on 1hr and 4hr and has already acted as resistance on the further swing down to 4498 from 4585 area.

(Please note my own trigger is on a 1min t/f and I look for similar set-ups to confirm the entry on the t/f's above that. As such and for the avoidance of confusion, I do not always look for a 'with trend' follow thru, in tghis case necessarily to a new LL in the 1hr downtrend, - dependant on price action and how it unfolds - Reason for not necessarily holding for a new LL, the set-up might come at what would effectively be a H on this t/f not an immediate LH in it's downtrend....so long as that was at a LH on 4hr t/f in it's downtrend it may be ok)

G/L


24o1q49.gif
 
Last edited:
It'd be quite nice to have template posted at the start so every post is in the same format and it's easy to skim through and the writer just has to post a chart.


Great idea Phil.

I'm sure there will be some setups proposed that will be difficult to shoe-horn into a specific criteria - but those will hopefully be the exception.


Two setups have been posted so far; one from bbmac and one from myself.

To kick the template off, I think the following would be helpful:

- Market/Currency/Stock/etc
- Time-frame
- Reason(s) for setup being high-probability
- Entry/Exit criteria/method
- Reason(s) setup may be aborted
- Expected time/date when setup/trade may trigger


Admittedly not a great start to a template, but a start nonetheless.


Magnus
 
Analysis of Setup #1...

Right, here's my post-analysis of Setup #1 posted yesterday...


I was looking for some sort of price-action (read: candle formation; pin, bullish engulfing-bar, etc.) as a trigger for an entry in the marked area around 141.50. I was not confident enough to enter when price reached the area itself - and I find this in general - currently moving in and out of consistency with my trading and so desire a trigger to aid me in entry and stoploss (I'm pretty good at letting trades run, mainly the confidence to actually enter a trade that currently holds me back).

I never took this trade as I never got what I would call a clear signal to trigger an entry for me. The closest I say was, as shown in the 4-hour chart below, a bullish-bar off the 141.50 level. At the time, the 150 pip bar seemed like a hell of a move - but is now looking less significant with price being nearly 350 pips above the 141.50 level.

NOTE: I am aware that there is probably a decent 4-hour Pin in there, if I had been using a different MT4 broker.

Also, I am less inclined to take a trade that does not occur in the Euro/US session (trying to gather more odds in my favour for any particular trade).


So, overall, a decent setup that seems to be still following through. Will perhaps to more analysis as it unfolds.

One more thing, on my feed, the low was 141.49. I find that truly astonishing! 1 pip beyond the 141.50 level as mentioned.


Magnus
 

Attachments

  • 20-04-2009_gbpjpy_setup_1_2.gif
    20-04-2009_gbpjpy_setup_1_2.gif
    21.8 KB · Views: 336
  • 20-04-2009_gbpjpy_setup_1_3.gif
    20-04-2009_gbpjpy_setup_1_3.gif
    17.7 KB · Views: 336
Analysis of set-up # 2

Price indeed found resistance in the previous 1hr/4hr support zone=potential sbr (first coulured zone shown in pic in post above) in the overnight/asian range and re-tested the zone from a HL at the previous 4466 lows (3 fibs cluster of major swings 3505-5066) for another short opportunity on the lower t/f's. The HL on the 1hr meant that I did not hold the short for a 'with trend follow thru to new LL's' target and another HL on this 1hr t/f saw the zone break with price then finding support at the now broken resistance zone for a further move higher to the purple zone shown in above picture which resulted in a shorting opprtunity at the confluence of the 2 x fibs. A short down from this purple zone previous swing lows = previous support=potential resistance with the 2 x fibs confluence of the swings down from 5066-4466 (trigger on the sub 1hr t/f's)saw price again find support at the now 23.6% of the 4466 - 4707 move up.

The 1hr chart now looks as follows

n1cme9.gif
 
Set-Up # 3

Tomorrow [and depending on how the charts and the potential supp/res/sbr/rbs zones change overnight on this Gbpusd 1hr chart] I will be looking for shorts on the lower t/f triggers at zones a-E and possible long entries at zones F-I.

I will be looking for set-ups on the 1 5 and 30min time frames, using 1 or 5min as the trigger.

These zones are previous swing lo or hi's and therefore previous support or resistance that may act as supp/res/sbr/rbs if tested again. Obviously the most obvious zones and most recent should excercise most influence over price in repect of their potential for supp/res and I will look for confluence of other factors as well as where the zones on the lower and upper time frames co-exist with this 1hr for extra confluence.

The targets I set for shorts at zones a-e will depend on how many time frames a confirming reversal set up develops on and the potential strengthy of the prevailing trend and potential resistance. these considerations will also figure for any longs taken at the other zones f-I, as well as any other shorts or longs that may develop at potential sbr/rbs zones that may develop as price devlops.

G/L


2euogsw.gif
 
Last edited:
bbmac

bbmac,

Thank you for Setup #2 and your post-analysis of it. Fully appreciate that you can't really be too specific with your entries/exits. It's interesting to hear what your thoughts are, what you plan to do, and what you did.

Look forward to seeing your analysis of Setup #3 (assuming there is some follow-through with it).


Magnus
 
Resisting the urge...

I had a setup last night that I was going to post here - and obviously didn't. Personally, I plan to only post setups that are fairly high probability (or maybe have a large potential R:R instead, not sure how relevant this would be).

The setup in question was an overnight (GMT) trade that just missed my criteria as "high probability"... looking at it this morning it worked out perfectly (with even more profit than I had anticipated).

Why am I going on about this "potential" setup that has come and gone?... because... despite the fact that I think the post-analysis of this particular setup would be of interest, I am resisting from posting it. Funnily enough, the urge is quite strong to post it here - but I will refrain. It would be great to keep this thread on-track with the initial aims - for a while at least.

There has been a great response to this thread from fellow members. It would be a shame for it to get derailed before really getting off the ground.

Also, thank you bbmac for your setups so far.


Magnus
 
Set-up #3 Analysis

Gbpusd: When I started my trading session this morning price had already sold down [from that zone A] taking out Zone F, to create a new 5/30min downtrend. Price entered zone G only to see a 1min set-up (0813) with an imperfect 5min supporting set-up for a long there which saw +5pips max before a Re-entry to 5/30min downtrend after the pullback set-up @ 0829 at the potential sbr of the 5min previous swing lo=prev supp=potential sbr zone (created at 0635am) at which I entered short to get 'with 5/30min trend.' The set-up saw +35pips max before a Reversal set-up on 1 and 5min developed at the 2nd test (1 & 5min) of the 61.8% fib( 4466/73-4706 swings..blue dotted lines,) at which I entered long. This set-up saw some +25pips max. 0930am saw the release of Uk data which saw a further £ sell-off exceeding that 61.8% fib (blue dotted.) 0931 in the immediate post-data period, a 2nd test of the potential 1hr sbr=prev swing lo=prev supp=potential sbr saw an imperfect 1 min reversal and supporting 5min re-entry set-up and a very definate 1min entry candle (this 1hr previous swing lo is labelled as Zone J in pic below (Zones F and G being removed now) 1050 saw a Re-entry set-up to the 5/30min downtrend after a small pullback but as I could not identify the potential sbr, I rejected it...the set-up saw =20pips gain. Price then entered Zone H, at the 76.4% fib (blue dotted). I have a good 1min set-up 0951am) and an imperfect 5min supporting set-up to go long against the 5/30min (andd arguably the 1hr trend now) at this potential support confluence, and has seen +10pips gain as I write this and exit the trade as I am done for the day.

I am finishing here for the day as have to run out. Uk Budget later of course, and I may update this post later if get the time, but please be aware that this will be in retrospect, I will not have traded live, - I will make this clear in any update.

1246pm Edit: On my return, and a look back at what happened, I see that price again tested the potential support zone H with price recovering well from there up +130pips as I write this. I notice there was a good 1 and 5min set-up to get long at the low. There was no set-up at the zone J so I have removed the zone as price went above it, adding a zone at 4670-32 being a minor 1hr swing hi=previous resistance=potential resistance

1318pm Edit I have added in the new zone refferred to in 1246 edit above [4670-32 being a minor 1hr swing hi=previous resistance=potential resistance] and have labelled in Zone K. A nice reversal set-up on 1 and 5min occured in that zone (1257pm) at the confluence of the 1hr decsending res t/line ..this updated screeshot is at the the 2nd and lowest pic as price sells past the potential support zone H which now becomes a potential sbr zone.

1909pm Edit Price conttinued to sell past zones H and I those zones (Zone I see-ing a small pullback before a further leg down) then becoming potential sbr zones on the pullback up from 4396 lows. The zones have since been removed as they failed to offer any resistance as price rose to a 4539 recovery Hi, although Zone H did offer resistance for a further leg down to 4396 lows after a minor pullback.

2ep68no.gif


288o8c6.gif
 
Last edited:
Setup #4 Crude Oil

Market: Crude Oil

Timeframe: 1hr

Direction: Long

High Probability Setup:

- Double bottom on daily (see chart 1) provides decent floor of support.
- Daily pin followed by inside candle show up at the daily level.
- Breakout of ascending triangle pattern on hourly is bullish. (see chart 2)


How I will enter this trade

I will wait for a breakout and retest of the resistance from above (expecting it to then hold as support).

I will wait for a hammer or inside candle to form at that area and play that in the usual way. (entry above, stop below)

How I will manage this trade

I will look to take half the position off at $50 and ride the remaining half with stops below the low of each candle that closes above one of the key levels to the upside.

Those being:

$51
$51.48
The descending trend line coming in right now at around $52.50

If price consolidates ABOVE any of these levels and gives me another setup to go long and I still have some of my position, I will look to ADD to it.

Why I would not just play a break out.

1. The stop would have to go at 48.36 (beneath the swing low) to be safe, in my opinion, which skews the R:R unfavourably. Especially since;

2. The $50 key round number is just above. One cannot rule out a quick break to here and then a rejection off this level.

3. Equities have rejected key levels recently and a break lower in those will threaten this trade. I am bearish equities.

4. The market tends to want to test the validity of levels it has broken out of, after the initial euphoria. Once the retest is underway it is like the market is making a more careful and rational decision than the initial break.


Comments:

1. There is always the possibility that, as the resistance is very significant, that the market may break violently and not look back. I do not chase it, so if that happens, I will not be in. However, my entry criteria (buy on a retest) will remain in play indefinetly as this is a strong level on the hourly.
 

Attachments

  • crude1.gif
    crude1.gif
    18.2 KB · Views: 347
  • crude.gif
    crude.gif
    24.5 KB · Views: 365
Last edited:
Dante...

Tom, you've just set the standard for templates. Great stuff. Very clear.

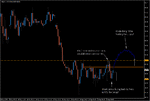
I have attached a chart with a couple of questions/thoughts on your Crude Oil Setup.


Magnus
 

Attachments

  • 2009-04-23_Setup_4_OIL_1.gif
    2009-04-23_Setup_4_OIL_1.gif
    22.7 KB · Views: 318
Set up #4 Analysis

The market broke out initially and was rejected just ahead of $50 on bearish equities (as expected in previous post).

The market then came back and retested the breakout point (albeit squeezing slightly lower and breaking the ascending TL - remember it is a zone).

The market formed an inside candle which closed positively, above the s/r pivot and this then provided the entry long that I explained in the previous post, I was waiting for.

First half was closed for 64 ticks profit.

Second half still running, with a stop under the low of the last candle that closed above a pivot. The stop on the second half currently protects 131 ticks profit and is being left to run.
 

Attachments

  • setup4.gif
    setup4.gif
    19.1 KB · Views: 346
The market broke out initially and was rejected just ahead of $50 on bearish equities (as expected in previous post).

The market then came back and retested the breakout point (albeit squeezing slightly lower and breaking the ascending TL - remember it is a zone).

The market formed an inside candle which closed positively, above the s/r pivot and this then provided the entry long that I explained in the previous post, I was waiting for.

First half was closed for 64 ticks profit.

Second half still running, with a stop under the low of the last candle that closed above a pivot. The stop on the second half currently protects 131 ticks profit and is being left to run.

Trader Dante, I'm just wondering what made you trade retest of 49.10 and not the initial breakout? That is, what made your entry a higher probability setup?
I know you talked of an inside candle. Is this just that it didn't go below the lows of the previous candle?

Forgive me if I'm asking basic question - I'm fairly new to all this and am desperate to learn more! Thanks.
 
Trader Dante, I'm just wondering what made you trade retest of 49.10 and not the initial breakout? That is, what made your entry a higher probability setup?

Because support turned resistance is, what I believe to me, the underlying sructure of the market. The movement and rhythm of the market only became clear to me when I looked at it in this way.

Besides, I answered that exact question in my original post under the heading: Why I would not just play a break out.

I know you talked of an inside candle. Is this just that it didn't go below the lows of the previous candle?

Or above the highs of the previous candle...
 
Setup #5 EUR/JPY

Market: EUR/JPY

Timeframe: 4hr

Direction
: Long

High Probability Setup:

- Round number 125.00
- 50.0% Fib
- [debatable] Trendline
- Potential 2-bar Pin on 4h chart


How I will enter this trade

If a 2-bar Pin is formed on the 4h chart I will look to go long on break of Pin.


How I will manage this trade

Will possibly look to take some off at 126.00.

Move remaining up as price moves in favour.


Comments

There is a lot of overhead resistance. Provides hesitancy.


Magnus
 

Attachments

  • 2009-04-28_Setup_5_eurjpy_1.gif
    2009-04-28_Setup_5_eurjpy_1.gif
    21.7 KB · Views: 186
  • 2009-04-28_Setup_5_eurjpy_2.gif
    2009-04-28_Setup_5_eurjpy_2.gif
    21.8 KB · Views: 203
Setup #5 void.

However, staying alert for a daily Pin.


Magnus
 

Attachments

  • 2009-04-28_Setup_5_eurjpy_3.gif
    2009-04-28_Setup_5_eurjpy_3.gif
    16 KB · Views: 228
Thanks Yuppie. In the interests of learning, I just wondered why you declared it void? Why not consider playing the inside bar?
 
Last edited:
Top