You are using an out of date browser. It may not display this or other websites correctly.
You should upgrade or use an alternative browser.
You should upgrade or use an alternative browser.
Best Thread Potential setups
- Thread starter trader_dante
- Start date
- Watchers 274
- Status
- Not open for further replies.
rags2riches
Well-known member
- Messages
- 399
- Likes
- 135
I know some of you were short from one or both of these pins on Usd/Cad...a good example of why it pays to try and hold...
Holding this looks p*ss easy with hindsight (see chart) but one would have had to sit out a 300 pip retracement.
Retracements against your position may well scare you but try to set your stop based on where the trade is TECHNICALLY invalid (not just based on how much you can bear to give back from your wins) and WALK AWAY 🙂
You give a lot back...but when you hit a runner...you hit a runner (especially nice if its paying you carry interest) !!!
I ended up risking 200pts and netting 400pts. I feel like this was a failed trade because I didn't pyramid, entered off the daily and exited off the hourly. Holding an FX trade for over 2 weeks is a new personal best though - I am slowly getting better. Next!
montmorencyt2w
Senior member
- Messages
- 2,619
- Likes
- 294
This is amazing!!!...
...with this Skype plug-in thingy on my web-browser I can actually call-up a specified chart price level!
This is the future of trading... :clap:
Magnus
They'll never get me up in one of those things!
A. Luddite
:cheesy:
montmorencyt2w
Senior member
- Messages
- 2,619
- Likes
- 294
Holding an FX trade for over 2 weeks is a new personal best though - I am slowly getting better. Next!
Nice one.
Well, if USD/CAD reverses like people are saying, that could be another long one.
However, although I can see how it might work technically, I don't quite see how it chimes with the fundamentals. However, I will trade what I see and not what I think/feel ... 🙂
vinicius
Established member
- Messages
- 795
- Likes
- 54
Thanks, Tom.
By the way, if someone can provide an outlook for AUDUSD for next week, I'd appreicate it. I have a long position +100pip and wonder if I should keep it.
Good weekend and good trading everyone.
Ilya
Nice trade Guys.. 👍
Very bullish candle on weekly and daily. The level of 8500 seems to be attracting the price..
Where did you guys leave the stop?
0.7700 look a nice spot to buy or add to the position and place the stop..
N Rothschild
Legendary member
- Messages
- 5,296
- Likes
- 603
ilplusq
Member
- Messages
- 88
- Likes
- 21
Nice trade Guys.. 👍
Very bullish candle on weekly and daily. The level of 8500 seems to be attracting the price..
Where did you guys leave the stop?
0.7700 look a nice spot to buy or add to the position and place the stop..
Exactly. SL@ 1 pip below 0.7700. I entered on the daily pinbar on May 26, treating it as a break and retest of 0.7700.
bbmac
Veteren member
- Messages
- 3,584
- Likes
- 789
Gbpjpy Doji close-friday
Gbpjpy has formed a doji candle on friday's daily candle close at the 38.2% fib of the 251.14-118.47 fall. The candle also falls in wat is a pevious monthly swing low=previous support=potential sbr zone.
Possible threats: Gbp is strong atm and a lot of the £ crosses have finished the day/week/mth with strong bullish candles. I would be happier if that potential sbr zone were nearer term on the weekly chart as opposed to the monthly for a daily candle trigger... that said there is hidden divergence on the weekly chart and bearish sequential divergence in the daily oscillators.
Near term Potential barriers to the downside are the previous swing hi's zone=previous resistance=potential rbs and straddling that Daily zone just outside it are the 23.6% and 38.2% of the 138.91-155.71 swing up @ 151.75 and 149.32 respectively. Also around that 149.32 ids the 50% of the shorter 142.99-155.71 swing up @ 149.38 and withion the zone itself is the 38.25 of that shorter swing up @ 150.90
G/L
Last edited:
bbmac
Veteren member
- Messages
- 3,584
- Likes
- 789
Gbpusd..correction to uptrend possible?
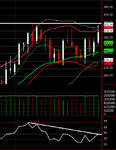
There is hidden divergence building on the weekly chart indicating at least a correction to the uptrend that has developed to the daily , possible weekly chart off 3505 low, may occur. The first chart below shows that hidden divergence in all 3 oscillators on the Weekly chart.
In respect of potential sbr/res the second chart shows the monthly previous swing lo=previous support=potential sbr zone which is a way off yet. Ahead of that zone there are 3 significant fibs of the swings down to 3505; 6698 = 61.8% 8668-3505, 6839 = 50% 0157-3505, 6949 = 50% 0390-3505 and in that zone there is the 50% of the major 2.1162-1.3505 swing down @ 7337 There is no obvious potential sbr/res zone on the weekly chart below this monthly zone.
If I were trading off the daily trigger I would be looking for a decent daily reversal candle (pin, inside, engulfing etc...) at these levels and some oscillator extremes or divergence on that t/f.
Nearer term potential sbr/res and you have to dip down to the daily chart..the third screenshot below. it shows a previous swing hi=prev res=potential resistance (a) 6367-6687 and a previous minor swing low =previous support=potential sbr (b) 6772-7027 at which I might look for a 4hr set-up possibly fine tuned on the 1hr. As you will see both these daily zones encompass some of the fibs mentioned above.
Closer still potential resistance and price clsoed on friday in and toward the top extreme of the previous 1hr swing hi=prev res=potential resistance zone 6156-96, 6196 being area of friday's hi. The Dly wkly and Monthly candle closes look very bullish?
Last edited:
grimweasel
Well-known member
- Messages
- 488
- Likes
- 108
BBMAC
I'm surprised! I had you down as a good old Price Action(PA) only man; not using them awful historical painting indicators - all you need to know is there in the PA!!😕
I'm surprised! I had you down as a good old Price Action(PA) only man; not using them awful historical painting indicators - all you need to know is there in the PA!!😕
N Rothschild
Legendary member
- Messages
- 5,296
- Likes
- 603
There is hidden divergence building on the weekly chart indicating at least a correction to the uptrend that has developed to the daily , possible weekly chart off 3505 low, may occur. The first chart below shows that hidden divergence in all 3 oscillators on the Weekly chart.
In respect of potential sbr/res the second chart shows the monthly previous swing lo=previous support=potential sbr zone which is a way off yet. Ahead of that zone there are 3 significant fibs of the swings down to 3505; 6698 = 61.8% 8668-3505, 6839 = 50% 0157-3505, 6949 = 50% 0390-3505 and in that zone there is the 50% of the major 2.1162-1.3505 swing down @ 7337 There is no obvious potential sbr/res zone on the weekly chart below this monthly zone.
If I were trading off the daily trigger I would be looking for a decent daily reversal candle (pin, inside, engulfing etc...) at these levels and some oscillator extremes or divergence on that t/f.
Nearer term potential sbr/res and you have to dip down to the daily chart..the third screenshot below. it shows a previous swing hi=prev res=potential resistance (a) 6367-6687 and a previous minor swing low =previous support=potential sbr (b) 6772-7027 at which I might look for a 4hr set-up possibly fine tuned on the 1hr. As you will see both these daily zones encompass some of the fibs mentioned above.
Closer still potential resistance and price clsoed on friday in and toward the top extreme of the previous 1hr swing hi=prev res=potential resistance zone 6156-96, 6196 being area of friday's hi. The Dly wkly and Monthly candle closes look very bullish?
IMO the time period is to great to use any sort of divergence..thats just me though
N Rothschild
Legendary member
- Messages
- 5,296
- Likes
- 603
bbmac
Veteren member
- Messages
- 3,584
- Likes
- 789
BBMAC
I'm surprised! I had you down as a good old Price Action(PA) only man; not using them awful historical painting indicators - all you need to know is there in the PA!!😕
My own tactical approach to the intraday market is in looking for hi-probability individual price action triggers at pre-identified potential support/resistance/sbr/rbs with a repeating indicator pattern comprised of band/channel deviation and oscillator extremes/divergence. The use of hi-probability repeating indicator patterns enhances my decision making as individual price action alone on my 1min trigger can be less reliable that on higher time frames. If I were trading off a higher trigger time frame I would be less inclined to use the indicator patterns as individual price action triggers are generally more reliable than on the lower time frames.
bbmac
Veteren member
- Messages
- 3,584
- Likes
- 789
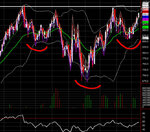
IMO the time period is to great to use any sort of divergence..thats just me though
I am confused by your assertion? Technical indicator readings work on all time frames, and it's just a question of how you read them. Take the Gbpusd weekly chart shown below as an example, this is a classic bullish divergence reversal pattern (notice despite lower price osma stayed above it's zero axis) where the shorter term volatility has become less than the longer term volatility represented by the shorter setting bol band coming inside the longer settings, with a great individual price action trigger shown by the red arrow. (actually it's one of the classic indicator patterns I look for that I call a Reversal type B)

Last edited:
N Rothschild
Legendary member
- Messages
- 5,296
- Likes
- 603
i concur with those charts there
jiggly
Well-known member
- Messages
- 478
- Likes
- 65
check this beast..but what is it? 😛
thats gold!
I have had my eye on that for ages. that could potential trade at $1400/ounce, some time in the future.
the only thing I am concerend about with that set up is that it is a little 'dirty' with no clear, pivotal points.
still a good long term play on the long side..
N Rothschild
Legendary member
- Messages
- 5,296
- Likes
- 603
well, we had an inital EW 1,2,3,4,5 with an ABC correction, so probably starting another 5 wave..so this would be wave one, potential pull back to $920. Im going to have a nibble at $965 and if that fails buy a pullback to $920
montmorencyt2w
Senior member
- Messages
- 2,619
- Likes
- 294
My own tactical approach to the intraday market is in looking for hi-probability individual price action triggers at pre-identified potential support/resistance/sbr/rbs with a repeating indicator pattern comprised of band/channel deviation and oscillator extremes/divergence. The use of hi-probability repeating indicator patterns enhances my decision making as individual price action alone on my 1min trigger can be less reliable that on higher time frames. If I were trading off a higher trigger time frame I would be less inclined to use the indicator patterns as individual price action triggers are generally more reliable than on the lower time frames.
Bbmac: What timeframes do you tend to trade on?
Cheers,
Mike
rawrschach
Experienced member
- Messages
- 1,223
- Likes
- 277
Divergence is a leading indicator
- Status
- Not open for further replies.
Similar threads
- Replies
- 2
- Views
- 8K