Best Thread Potential setups

Status
Not open for further replies.
Cadjpy

Hi all,

Bit of a long term set up for you as opposed to the excitment of intraday (i'm a crap scalper!).

CAJJPY weekly chart below to illulstrate the long term view first. Price is currently hovering around the historically important 84 level and last week broke above an ascending TL in with relevance back to 1994.

cadyenweekly.gif

Next is the daily chart showing two ascending TL's which have been supporting/resisting the upward trend since the beginning of the year. Price finally broke through the long term TL a week back Friday and the perfect confluence was last Wednesday when long and short term crossed, giving neither a hammer nor hanging man (at least to my novice eyes).

Todays action is obviously bearish but if it fails to break the TL, the support and momentum is there to look for PA to go long with some confidence.

cadyendaily.gif

Hope this of interest to the thread (i'm more lurker than poster across here)
 
some 2 bar hourly action on AUDJPY

Update: off a good level at 74. Resistance into support. Clear air above recent highs if it goes.
 
Last edited:
Usdcad

The retracement bus for shorters on USDCAD could be coming up soon...
50% retracement of Fridays bar and 1600 level maybe
 
The retracement bus for shorters on USDCAD could be coming up soon...
50% retracement of Fridays bar and 1600 level maybe

I think we need to see it break the 1.16 level to see if there is any interest around / above that level, take out some stops etc.....
 
gbpusd

Cable finds support at the prev minor sw hi circled in white, the 23.6% of the 4512-5248 being in the vicinity too. No real 1hr price pivot near to current price in terms of SBR potential , 50% fib of the 5248-5066 current down move nearby.

G/L

2j5ia80.gif
 
another point of view

Quick heads up on a level for NZDUSD.......

I look at NZDUSD a little differently. It is possible that it is a breakout to the upside of the descending TL and now the price is trying to test it from above before taking off higher. The more recent ascending TL is there, too.
 

Attachments

  • 2009-05-11 nzdusd d1.gif
    2009-05-11 nzdusd d1.gif
    15.2 KB · Views: 141
  • 2009-05-11 nzdusd w1.gif
    2009-05-11 nzdusd w1.gif
    14.4 KB · Views: 131
Last edited:
geppy analysis

Did anyone trade the GBP/JPY today? There were lots of bearish signals last night and this morning. Bearish flag on weekly and two pin bars, BEOBs and even IBs on hourly!! I've done a bit of amateurish analysis below, please be critical I need to pan this in to my head somehow!!

I made 3 trades (2 were IB trades on demo) and I can't believe they went so nicely especially as I was a bit nervous going against the uptrend from start of 2009. I find that trading has the unique ability of knocking my confidence which I don't find in other things, but hopefully I'm on the right path to confident trading and some reasonable semblance of consistency. :)

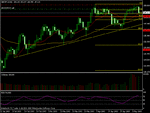
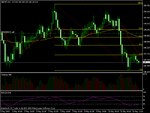
As to my charts, I'm now out of all shorts. Things are still looking bearish (evening star on daily, 20 MA crossed 50MA to downside on hourly) but there is some bullish divergence on 1hr, so I I will wait for a retracement up to around the 148.8 area which is 50% fib and 50MA. If it reaches here I'll be looking to go short based on PA with a target of between the daily 50%-61.8% fibs (145.4 - 144.1). Could do with being more accurate on those targets (I'm still struggling to define these correctly) but I'd be happy with either lol! Red lines on daily are actually coming from weekly s/r lines.
 

Attachments

  • geppy1d_11may09.gif
    geppy1d_11may09.gif
    15.6 KB · Views: 145
  • geppy1hr_11may09.gif
    geppy1hr_11may09.gif
    17 KB · Views: 141
Did anyone trade the GBP/JPY today? There were lots of bearish signals last night and this morning. Bearish flag on weekly and two pin bars, BEOBs and even IBs on hourly!! I've done a bit of amateurish analysis below, please be critical I need to pan this in to my head somehow!!

I made 3 trades (2 were IB trades on demo) and I can't believe they went so nicely especially as I was a bit nervous going against the uptrend from start of 2009. I find that trading has the unique ability of knocking my confidence which I don't find in other things, but hopefully I'm on the right path to confident trading and some reasonable semblance of consistency. :)

As to my charts, I'm now out of all shorts. Things are still looking bearish (evening star on daily, 20 MA crossed 50MA to downside on hourly) but there is some bullish divergence on 1hr, so I I will wait for a retracement up to around the 148.8 area which is 50% fib and 50MA. If it reaches here I'll be looking to go short based on PA with a target of between the daily 50%-61.8% fibs (145.4 - 144.1). Could do with being more accurate on those targets (I'm still struggling to define these correctly) but I'd be happy with either lol! Red lines on daily are actually coming from weekly s/r lines.

Hello mate,

You've got a plan: which is a very good start and, in my opinion, is a key element that defines winners from losers.

With regards to your level to get short, I would say that a retracement to 148.10 area would be a better level to look for PA as it combines a recent strong hourly support (which we would expect to become resistance) with the 38 fib level.

As far as targets I would be putting an emphasis on s/r pivots rather than fibs.

My daily targets would be:

145.00 - 145.70 (big s/r band) and below that I have 142.00.
 
Anyone looking at the GBP/CHF daily pin? If you got in on the break of the hourly earlier to today, could be a great place to add!
 
Status
Not open for further replies.
Top