advfntrader
Established member
- Messages
- 739
- Likes
- 66
GBPCHF Daily Pin now triggered also
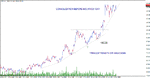
just an update on the vedanta trade,i am closing it now for a 50% gain.it is at the top of a consolidation range and had a good run.when it breaks this range i shall look to get in again.good luck all.
How do you draw those lines on MT4?
How do you draw those lines on MT4?


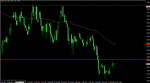
I think someone mentioned this pair last week. Price through support at 20000 and has now come back to test this level from the other side. Just hoping for some price action to signal a rejection of this level and then short it.
View attachment 56434
View attachment 56436
Like this?
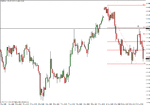
usd/jpy pin might come off a significant level but the selloff on right shoulder has come from a more significant level (99.40) area . Also the daily candle has settled well below 200 ema putting a downward bias. you can trade that pin but it hasnt got that significant swing trading reward..
best of luck
ouch a lot of stops got hit on usd/jpy ...