Best Thread Potential setups

Status
Not open for further replies.
Nice level coming up

interesting levels for most of the JPY pairs.
 

Attachments

  • chfjpy.gif
    chfjpy.gif
    15.8 KB · Views: 215
hello traders gizmo back.. just wanted to share a brilliant corelational trade done today.. dante trader
where the hell you been huh .. dude we could have cracked this together if you were on yr desk ..

righty we will be taking corelation of eur/jpy --- driving force behing eur/usd moves and DX as a basis of out trades.. also tradeers note eur/jpy negatively corerelated with indices which were appearing on top of daily channel

entry criteria .. euro hovering around 1.3673 resistance since yesterday and failed attempt ..
london open rejects 1.3673 and is reverting back ..

breaks a 5min minor supports indicating momentum on downside increasing ..( notice broke trendline and tested in a 1-2-3 kinda pattern) --

euro establishes a new low 1.3564 and recovers where by selling the rally becomes my theme so looking for good entry oportunity and eur/jpy is heading towards a potential H&S pattern ..

took short euro at 50% 1.3618 which was also tested previously prior the breakout occured.. also to note eur/jp approaching 50% fib which could assist in right shoulder formation..

also DX looking pretty good to support a short euro..

also note a second opportuntiy to enter when prices cameback to test neckline of broken eur/jpy shoulder .. and euro appraching 12:15 gmt (or 14.15 as in chart)..

i put this charts so that i can share my approach for market trades where market gives you a hint on whats coming!!

best of luck traders ..
 

Attachments

  • euro.gif
    euro.gif
    34.4 KB · Views: 197
  • eurojpy.gif
    eurojpy.gif
    31.4 KB · Views: 182
  • dax.gif
    dax.gif
    29.1 KB · Views: 185
What was your first entry and what was the exit where you said you jumped ship early?

attachment.php


I found sitting through that pull back to become brutal. I'm new to trading cash, and I've started off with a few losers, so I just wanted to lock in some sort of profits. The r:r on the trade was close to 1:5 and that was a justification(bad) for me to manually close. Normally I will move my stop under PA that I feel means the trade is over if price is to reach it. But look at how price accelerates upward after breaking the tl, then we have a very minor pullback, followed by another shot up and a deeper pull back. As this pull back was forming all I could visualize was price potentially plunging back through this space.

Clicked close and breathed a sigh of relief. I got some money! Then I kept watching as price started forming support right after I sold. And eventually works it's way higher, where admittedly it doesn't reach my target area, but I still would've gained more if I just let price move and used my stop loss in a logical manner.
 

Attachments

  • eu3-24m5.gif
    eu3-24m5.gif
    10.3 KB · Views: 799
Last edited:
I wonder how this will end up on the Daily?

Thoughts anyone?

If it ends as a pin, then it's possible to concoct a 50% retrace (chart 1), but to be honest looking at the Weekly (chart 2) it's just broken through 131 on the 4th attempt so that would be a good opportunity to buy IMO.
 

Attachments

  • eurjpydgif.gif
    eurjpydgif.gif
    10.3 KB · Views: 175
  • eurjpydwgif.gif
    eurjpydwgif.gif
    8.5 KB · Views: 195
and a chart to show why.

I hope there is more to that TL than your chart shows...it looks far too steep and has been tested at only two points?!

Also, what's this about the high being tested four times...it has broken through a huge weekly level to the upside...

Oh well, I hope it goes well for you. Fingers crossed.
 
I hope there is more to that TL than your chart shows...it looks far too steep and has been tested at only two points?!

Also, what's this about the high being tested four times...it has broken through a huge weekly level to the upside...

Oh well, I hope it goes well for you. Fingers crossed.

The big candle to the left makes it seem (to me imho) that price is still in a box consolidation?:love:
 
Last edited:
If it ends as a pin, then it's possible to concoct a 50% retrace (chart 1), but to be honest looking at the Weekly (chart 2) it's just broken through 131 on the 4th attempt so that would be a good opportunity to buy IMO.

Thanks Joey, I think I learnt a lot from that. (y)
 
Eur/Usd DBHLC

Hi TD. I've really gotten a lot out of your threads on here. I've been a J16 student as well. I've found that I've gotten a lot out of your posts as well as Mbqb11, Clockwork and Raczekfx over on FF.

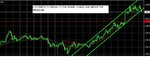
I'm REALLY working hard on my patience, but its not easy. I took a DBHLC on EUR/USD 4 hour today off a key resistance level of 1.3660 (weekly). Its been struggling there for the last few days and has consolidated between there and 1.3480. I actually took the short off a different MT4 feed and got it at 3585. It went down to 1.3480 and bounced up, but I held onto it even when it almost came back to my entry. Price has since revisited and pushed through the 1.3480 PPZ (weekly and daily). My plan is to take this to the 1.3325 to 1.3300 area and possibly cover and go long if PA tells me to. Until then I'm trailing behind S/R zones that form along the way.

I really suck at being patient, but your threads have inspired me. I'm going to need a lot of antacid, but I will make it and be a patient trader and let the setups dictate entries and exits, not my stomach or God forbid my brain! :LOL:
 

Attachments

  • eurusd mar24 09 h4.gif
    eurusd mar24 09 h4.gif
    21.6 KB · Views: 148
  • eurusd mar24 09 daily.gif
    eurusd mar24 09 daily.gif
    23.5 KB · Views: 153
I like the look of this

I like the look of the pin bar that looks likely to be formed on the Eur/Jpy too it falls on the 38 and 50 fib lines on my charts. It has gone nearly 1000 pips with out a pull back. I think this could be a good play
 

Attachments

  • eurjpy.gif
    eurjpy.gif
    55.2 KB · Views: 153
I like the look of the pin bar that looks likely to be formed on the Eur/Jpy too it falls on the 38 and 50 fib lines on my charts. It has gone nearly 1000 pips with out a pull back. I think this could be a good play

watch out for a bounce around 131.00
 
im short GBP/JPY here 143.66
100 pips stop. Experiment trade

Covered half here for + 75 (other half now stop at BE)
Just an experiment as stated before to try my hand at a something different. I managed 80 pips on the ES yesterday and 40 on oil doing my 'preffered' method of trading. Think ill leave this swing stuff to someone else for now :)
target is about 142.00
 
Status
Not open for further replies.
Top