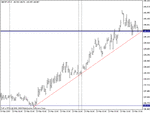
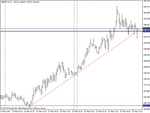
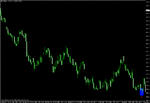
I'm going long EURJPY now as we have had a retest of 131ish which is the top of the recent daily/weekly range.
dude on the possable 4H pin??
I'm going long EURJPY now as we have had a retest of 131ish which is the top of the recent daily/weekly range.
dude on the possable 4H pin??
dude on the possable 4H pin??
Hi Pat,
Not sure if you meant myself or supermeg, but if it was directed to me-
I was looking at an Oanda 3hr chart and half way in to the 3hr candle it looked to me like a good pin-like rejection of the 131 area which i had marked on my chart. I didn’t wait for the bar to close (which by right i should have) and went long at 131.32. It has just rejected off 132 resistance area now but my target is 135 and 141.5 (being very optimistic 😉) if it can get through the 132.30 level.
Shane
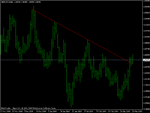
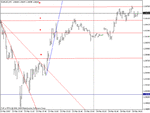
is there a 4-hr pin-bar on the GBPJPY, rejecting the previous highs of 141.50/70?
EDIT: the pin-bar isnt any old one, it seems to be at previous confirmed Res.
I had weekly resistance level at 1.4190 and I am out of my long.
There is no pin on my chart, it is an IB. I am still bullish but don't see us getting there today.
is there a 4-hr pin-bar on the GBPJPY, rejecting the previous highs of 141.50/70?
EDIT: the pin-bar isnt any old one, it seems to be at previous confirmed Res.
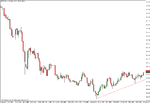
Hey Trendie, it's not quite a pin on my 4hr chart...the body lies slightly outside the candle to the left of it...a lot of people might say this hardly matters but it is just the rules I apply...
At any rate, the next candle was an "Inside candle" which might be a better play (entry below, stop above) as it would provide a tighter stop and it would trigger at more or less the same time as the pin anyway...see chart 1.
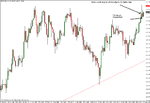
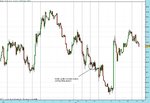
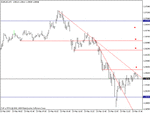
I would add, however, that this is not a trade I am going to take. I don't like the look of the bear campaign from the daily chart, AT ALL. (chart 2). The market is being drawn towards 142.00 and as Lewtz said in a post a while back...when the market keeps being drawn towards a level, it's going to want to try and take it out.
A big part of my technique in trading PA bars is looking at the daily and trying to imagine how it would look if I took a setup I've seen on a lower TF.
It's a very abstract concept that is hard for me to explain. But what I mean is, if I took a 4hr pin and it was going to be profitable then tomorrows candle and perhaps the next few would need to be red on the daily TF. But when I look at the daily TF, I just can't imagine seeing red candles now. And if I can't imagine it, I can't take the trade.
Apologies if that sounds plain weird and confuses anyone....
break out on d/t/f and look for a retest and set up?
shane thanks dude
2 lots? 2 targets?


It might be a play. That is certainly the pattern I would look for (breakout and retest).
But it has to look PERFECT for me to trade it.
I'm really not trading all that much in my personal account at the moment. There is a shortage of things that I think are good enough for me to take.
I've only done 4 trades so far in March.
Dax: +73 ticks
SMI: +70 ticks
Bund: -27 ticks
Euro: +55 pips
Total: +171 ticks
I had weekly resistance level at 1.4190 and I am out of my long.
There is no pin on my chart, it is an IB. I am still bullish but don't see us getting there today.
I wish I could say I stayed in the trade, but I jumped ship early. Now I get to watch this move on up without me and watch all the potential pips I could've had.
This is one of my short comings I'm dealing with. Hold the trade! Let it work it's way to the next level!
There was/is no reason to exit your long, just draw a simple trendline from the low of the entry around 137.20...