You are using an out of date browser. It may not display this or other websites correctly.
You should upgrade or use an alternative browser.
You should upgrade or use an alternative browser.
Best Thread Potential setups
- Thread starter trader_dante
- Start date
- Watchers 274
- Status
- Not open for further replies.
1Pipped
Well-known member
- Messages
- 273
- Likes
- 35
a question for you all,on days like this with such a large range do you consider the daily pivot levels to be inaccurate or un realistic??
Do you mean the calculated pivots (high+close+low... etc), or s/r pivots from daily charts? I dont use the calculated ones myself, but Ide still pay attention to the s/r pivots.
Spurs explained it best when I was asking about s/r pivots getting broken and if theyre still any good afterwards.... he said: yes because its a pivot, it has to get broken sometimes or else it couldnt be a pivot... sounds obvious but I hadnt thought of it like that before.
I think your talking about the calculated ones though, and if S1,S2...R1,R2 etc are unrealistic? the thing is how would you know its going to be a large range day until the day is over, and by then price will have cleared R3 already!
If I was going to use pivot points Id ignore the s1,s2,s3... altogether and just use the pivot point itself and only if it lines up with something else (round number, fib level, s/r) but I know you use them differently than that..... so the answer is, I dont know 😉
mornin pip,im talkin about the h+l+c/3 type,i understand about the pivots i draw bur for e.g. the daily calculated type from us/ye yesterday,are using a range about twice its normal daily range so the pivots will be equally far apart.my q. is why should today be as volatile as yesterday.
i also use monthly and weekly and price reacts regularly to these levels,especially when there is confluence.
i also use monthly and weekly and price reacts regularly to these levels,especially when there is confluence.
mornin pip,im talkin about the h+l+c/3 type,i understand about the pivots i draw bur for e.g. the daily calculated type from us/ye yesterday,are using a range about twice its normal daily range so the pivots will be equally far apart.my q. is why should today be as volatile as yesterday.
i also use monthly and weekly and price reacts regularly to these levels,especially when there is confluence.
Hi Jonj,
Do you calculate the floor pivot points yourself or is this done automatically on your charting software? Mine provides daily pivot points only, not weekly and monthly. I was just wondering if you do calculate yourself, do you verify the h, l, c figures at an independent source?
Arf
hey Arf,my pivots are done automatic by my mt4 platform,and no i dont varify the numbers as 1: im far too lazy and 2:i want to trade them from this platform so i dont see any value in the prices of other brokers.could be wrong in this??Hi Jonj,
Do you calculate the floor pivot points yourself or is this done automatically on your charting software? Mine provides daily pivot points only, not weekly and monthly. I was just wondering if you do calculate yourself, do you verify the h, l, c figures at an independent source?
Arf
would like to point out that these pivots have to be confirmed by price before i take them seriously.but when they coincide with my hand drawn lines or if the daily,weekly and monthly coincide they hold there water.
Attachments
1Pipped
Well-known member
- Messages
- 273
- Likes
- 35
hi jonj, I get you about the pivots now - if yesterday was a 'big day' then todays levels would need another big day to be useful because they are calculated off yesterday. If I was using them and the levels did line up with something, Ide still use them 🙂 but I see what you mean...
re: usd/cad it seems to be! now all I have to do is wait until it turns round and hits my stop, right? 😆 speaking of stops, I bet theres quite a nice pile of stops under 1.0000... but probably some buys just above...
re: usd/cad it seems to be! now all I have to do is wait until it turns round and hits my stop, right? 😆 speaking of stops, I bet theres quite a nice pile of stops under 1.0000... but probably some buys just above...
re: usd/cad it seems to be! now all I have to do is wait until it turns round and hits my stop, right? 😆
lol, i think thats where trading these signals goes wrong,everyone seems to want 5000 pips from every trade.its only when the pins etc show reversals at MAJOR turns in the market that these trades keep runnin imo.and that seems to be what T_D is good at but i think it takes more than knowing how to trade a pin bar to nail these major swings.
concider 20 pips daily with 50:1 leverage on only 1 lot per trade.
thats 200 * the investment per month! ok this is just numbers but the point being i dont think its necessary to look for big pips every trade but REGULAR returns over the longer term.
😉
Last edited:
1Pipped
Well-known member
- Messages
- 273
- Likes
- 35
Yep definately different ways to trade pins, and different types of pins. Imagine two traders trading the same four setups:
TraderA takes a loss on one, and makes 1:1 on the other three, so hes +2.
TraderB takes a loss on one, breaks even on one, makes 1:1 on one and makes 2:1 on the other so hes also +2.
TraderA has the benefit of regular returns, TraderB has the benefit of maybe catching a big run at some point.
on the loonie Im leaving the trade on because .... well, greedy really and too lazy to log in to Oanda lol, no seriously though, it cant hurt me now because stop is at b/e and it might make a lot more pips if it gets past 1.0
1Pipped
Well-known member
- Messages
- 273
- Likes
- 35
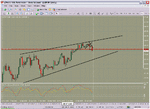
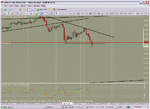
i like the look of that pin myself.i think there is possibly some retracement yet though.price is has met what might be some good support for now on the 4hour chart and is well oversold on stochs. also to look out for is the fact that this pair has just broken from a triangle formation which could be bullish.??
the gb/yen looks set to fall also ?👍
4h chart also shows a possible h+s,lets see if the right shoulder forms.
the gb/yen looks set to fall also ?👍
4h chart also shows a possible h+s,lets see if the right shoulder forms.
Attachments
Last edited:
just noticed that if you take the last two daily bars (eu/yen)as one and the previous 2 as 1 you get a nice outside bar that engulfs most of the previous weeks range.
dont know anything about joining candles so if anyone could give some enlightenment would be obliged,😉
dont know anything about joining candles so if anyone could give some enlightenment would be obliged,😉
Hi all,
There's an ascending head and shoulder on BHP Billiton and ML World Mining.
Pros: last Jan mining stocks fell with the index. Based on the last leg, Dow still got 800 points to go on way down, FTSE still got a long way down.
Cons: the neck is ascending, I can't find any data on likelihood of an ascending neckline being profitable in an uptrend. Descending necklines apparently are better.
Silver is making new highs.
Gold still stuck in trading range but could go up if DOW sell off gets worst.
Anyone care to offer some advice on the odds of this setup?
Bull trend in grains
Has anyone checked out the grains?
Got bullish trend on corn, oats soyabean meal & oil and wheat. In a few of these markets we've broken past the most recent high. Has anyone got any suggestions on entering this trend? These are all seasonal; could this just be the seasonal effect? Has anyone got any info on the fundamental of this+safe entry point ideas?
mornin yawl,quiet this weekend!!must have missed the party!🙁
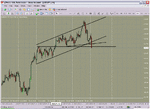
that 4h e/y pin seemed to have been a good call..nice one Eltrader 🙂👍nice easy entry on the break of fridays low wich would have been a test of the inraday lower trendline.Blasted right through the nearest sup.!!
gb/y is on its way also,presented a nice safe entry (imo)also broke down a little later that the us or eu so gave us a nice pause to work out the trade !!lol .my first target is around 209
Attachments
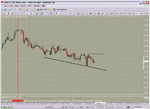
did anyone get the inside bar-db top?a nice 4h dbh right on the 38% fib of the last major raleigh wich coincides with the upper trendline of its current trading channel.this just below the high a previous double top. 👍
Attachments
- Status
- Not open for further replies.
Similar threads
- Replies
- 2
- Views
- 8K


