TD and you all,
I ask your opinion on this trade I took this afternoon.
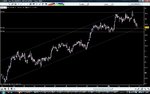
It was a long on a pin bar that formed on hourly TF. You see in first attachment it bounced upon a support line connecting two highs of last month, and a low of June 1st. In addition, there was daily pivot S2 at 827,50 which means confluence... In attachment 2 you see better the pin formation and.... how I was screwed up by price that took my stop just below the two lines.
I ask what you think about the trade itself... Would you have taken it?!? Do you believe the conditions were the right ones and I only was unlucky or maybe I'm missing something?!?
Just your humble opinion...
Many tahnks for feedback