You are using an out of date browser. It may not display this or other websites correctly.
You should upgrade or use an alternative browser.
You should upgrade or use an alternative browser.
Best Thread Potential setups
- Thread starter trader_dante
- Start date
- Watchers 274
- Status
- Not open for further replies.


bbmac
Veteren member
- Messages
- 3,584
- Likes
- 789
There must be big fish eyeing this level
What would get you involved in that market at that level, a daily perhaps fine tuned on 4hr trigger, see-ing as it is a weekly zone? (actually the previous lows are a daily zone too.)
G/L
rags2riches
Well-known member
- Messages
- 399
- Likes
- 135
What would get you involved in that market at that level, a daily perhaps fine tuned on 4hr trigger, see-ing as it is a weekly zone? (actually the previous lows are a daily zone too.)
G/L
I do nothing until it becomes clear whether the level will hold as support and start an uptrend or break and continue the downtrend (and possibly hold as resistance). The 1hr is the lowest timeframe I will drop to. Entering when a reversal is hitting the breakout traders is the extra confirmation needed. Given the way the $ is collapsing I will need lots of confirmation to go long.
On the hourly I want to see that downtrend line broken first before considering a long. I'm not a fan of breakouts but shorting below yesterday's lows might be a good play or alternatively a really strong reversal at that downtrend line. The cautious play is to wait for the break and try and short the retrace SbR.
I am trying to be a sniper and not shotgun my trades as I have been taught. I aim to trade less than once a day and more realistically once a week.
Attachments
trader_dante
Veteren member
- Messages
- 4,535
- Likes
- 1,704
bbmac
Veteren member
- Messages
- 3,584
- Likes
- 789
Thanks, nice insight.
I do nothing until it becomes clear whether the level will hold as support and start an uptrend or break and continue the downtrend (and possibly hold as resistance). The 1hr is the lowest timeframe I will drop to. Entering when a reversal is hitting the breakout traders is the extra confirmation needed. Given the way the $ is collapsing I will need lots of confirmation to go long.
On the hourly I want to see that downtrend line broken first before considering a long. I'm not a fan of breakouts but shorting below yesterday's lows might be a good play or alternatively a really strong reversal at that downtrend line. The cautious play is to wait for the break and try and short the retrace SbR.
I am trying to be a sniper and not shotgun my trades as I have been taught. I aim to trade less than once a day and more realistically once a week.
therooster
Junior member
- Messages
- 20
- Likes
- 8
Is anyone else having problems with IG chart plataform?
yes, froze up, kicked me out and cant get back on........
bbmac
Veteren member
- Messages
- 3,584
- Likes
- 789
gbpusd
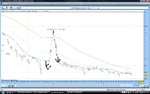
The arrow is pointing to the prev 1hr sw lo zone = prev supp=potential supp where price has garnished some support, the areas circled a and b coincide with minor prev swings on the 4hr chart too and could provide support on any extended correction from 6661 highs.

The arrow is pointing to the prev 1hr sw lo zone = prev supp=potential supp where price has garnished some support, the areas circled a and b coincide with minor prev swings on the 4hr chart too and could provide support on any extended correction from 6661 highs.
Bloodhound
Senior member
- Messages
- 3,467
- Likes
- 1,320
Is anyone else having problems with IG chart plataform?
It's worth having a back-up for when this happens - I think the last time was about a month ago. I have a demo account with fxpro which gives you free MT4.
HTH
Technically Fundamental
Senior member
- Messages
- 2,810
- Likes
- 178
Is anyone else having problems with IG chart plataform?
My IG Markets advanced charting has been disabled and they want £30 a month off of me all of a sudden
I bet 1 million newbies all shorted the FTSE and they never covered their ars*s
grimweasel
Well-known member
- Messages
- 488
- Likes
- 108
My IG Markets advanced charting has been disabled and they want £30 a month off of me all of a sudden
I bet 1 million newbies all shorted the FTSE and they never covered their ars*s
Aaron,
IG sent an email out about this a few months back. I think you still get the charting for free as long as you make 2 trades a month. I hear a lot of people were just opening accounts and using the free charting and not making trades. Sound busniess sense if you ask me? The intraday ProReal Time package is quite expesnive after all.
Technically Fundamental
Senior member
- Messages
- 2,810
- Likes
- 178
Aaron,
IG sent an email out about this a few months back. I think you still get the charting for free as long as you make 2 trades a month. I hear a lot of people were just opening accounts and using the free charting and not making trades. Sound busniess sense if you ask me? The intraday ProReal Time package is quite expesnive after all.
Yeh i sorted it now. It's because I didnt trade my live account for a month.
bbmac
Veteren member
- Messages
- 3,584
- Likes
- 789
Gbpusd
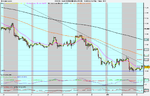
Cable finds support at the 23.6% of the 6048-6660 rise @ 6511 area on sell off from 6661 area-current intraday hi, and as yet has not troubled the potential rbs/supp zones shown at a & b on 1hr screenshot below. These zones are co-existent with a minor previous swing hi/lo zone repectively on 4hr chart.
Us data releases due later.
rawrschach
Experienced member
- Messages
- 1,223
- Likes
- 277
Last edited:
Although i agree with the premise of what you're saying, i think when the "Sun" or the "Mirror" run a headline story about sterling strength, that would be a better gauge.
bbmac
Veteren member
- Messages
- 3,584
- Likes
- 789
Gbpusd
Cable find resistance at the previous 1hr swing hi/lo zone (marked as point c) for a further leg down, (great Re-entry 2 set-up on 5min for those that know my set-ups) and then found support at that potential rbs zone a (the previous 1hr/minor 4hr swing hi) with the confluence of the asc supp t/line.
Zone b remains the next obvious previous imbalance of demand/supply should there be further £ weakness/sell-off, although struggling now at the 23.6% of the total move down today from 6661.
cable speculative short off 4hr bearish outside bar at 1.66 area.
let's see if this would just be a short term scalp or the turning point
woot! is this finally the real decline?
- Status
- Not open for further replies.
Similar threads
- Replies
- 2
- Views
- 8K