Observations of an exciting market...

WALKER
Yes your dead right about the oil / gold ratio.( See link for article)
http://www.zealllc.com/2004/goldoil3.htm

Not got the stomach for it myself, but will watch with interest (and then curse when it all happens!)

I'm not wishing to spark a side debate about definitions, but I certainly think gold can be labelled a currency.
Lets face it, if i walked into the local Porche garage looking like a scruffy git and then plonked a gold bar on the table, I would still get a test drive. ( no this is not my fantasy!)

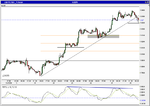
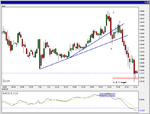
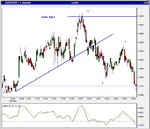
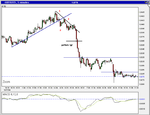
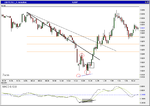
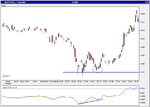
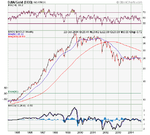
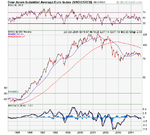
These links shows the DOW/GOLD ratio. And then the DOW/EURO ratio.
These charts are crucial to understanding the US stock bear. Against gold and the euro, the dow looks like a very sick puppy!

Most of the gains in the US stock markets over the last year or so are due to an inflating currency relative to the others. Gold provides a benchmark of value that I certainly would't want to be without.

Look at these charts and then tell me were in another secular Bull Market (US stocks).......complete and utter b******x
 

Attachments

  • SharpChartv05.png
    SharpChartv05.png
    21.1 KB · Views: 274
  • SharpChartv05.png
    SharpChartv05.png
    21.7 KB · Views: 251
Last edited:
The Euro/$ has just popped 50points on the open of the far eastern markets!
That never happens in the middle of sunday night................We don't usually get anything till London opens.
Somethings going on............
Watch this space............
 
Last edited:
Yes, the others broke out soon after.
This is going to be a volatile week, hold on to your mice.

Going back to the first post on this thread which was £/$..........we've got a significant triangle break here!
 

Attachments

  • breakout.gif
    breakout.gif
    79.1 KB · Views: 256
Last edited:
Got a close in view here.
Beautiful technical action...
We watched for a breakout and we've got a breakout...
Golds flying!
 

Attachments

  • £1.doc
    83 KB · Views: 274
Last edited:
$ weakness

GotGold said:
UPDATE ON THE $/Y TRADE

As we can see on the chart, this trade is evolving exceptionally well.

A 700+ pip move is expected from a triangle break of this size.

Watch this space......


Nice work on the thread Got Gold.

The key is $ weakness.

I am of the opinion we will see extensive USD weakness over the next few months. I believe 1.93 to £ possibly exceeding the 2.00+.

Which is bullish for yen strength my only fear is jap intervention which may take the bite out of the move, hence my preference for cable trading. Sony and Toyota need competitive pricing in there biggest markets so I feel a more controlled devaluation is likely.

I do feel the next pres whoever may consider devaulation there way out of the deficit situation and try the buy domestic stance pushing a possible growth slowdown in the rest of the exporting world.

Keep up the commentary i think the big triangle from the highs may have begun a breakout already but time may cause blushes. Good luck with your trading. Right about size by the way.
 
Thank you for the kind comments.
The thumbnail is 5min £/$. This triangle looks tradable tomorrow morn, however there could be some delay due to overnight lulls.

The other attachment is a close in of the $/Y action, 15 min chart.

Watch that resistance ceiling, as long as we are below it then we stay short term bearish.

I'll report tomorrow.
 

Attachments

  • $y.doc
    79.5 KB · Views: 233
  • £.gif
    £.gif
    124.8 KB · Views: 284
Last edited:
GotGold said:
Thank you for the kind comments.
The thumbnail is 5min £/$. This triangle looks tradable tomorrow morn, however there could be some delay due to overnight lulls.

The other attachment is a close in of the $/Y action, 15 min chart.

Watch that resistance ceiling, as long as we are below it then we stay short term bearish.

I'll report tomorrow.

Interesting. I think the short term £/$ may have broken downside a bit for today but after 9 updays it may always have been a possibility. long run my view is unchanged though we may have a further drawback. gfb

Support and resistance on Yen is well indicated by yourself, everyone underutilizes this I feel and it holds true more often than the more comlplex TA.
 
Small triangle break on £/$ was barely tradable. Moving by a big 20 pips! Often these shorter time frame set ups are less reliable, especially overnight..

However the $/Y levels seem to be holding, we are very much mid range here. Caught between a weak dollar and the promise of Jap intervention. This tug of war could last, so a 'range trading' approach might be worthwhile. But having said that, an expanding range is very unpredictable.

Looks like £ putting in a strong ceiling 18450, a revisit to this level could trigger a decent trend up or down.
 
Last edited:
they're certainly working hard to keep this thing bouyed....good support camps below to catch it on a wiggle down. And the 50's (half primes) are proving to be the important round numbers on the recent upkick!.....interesting play possibilities this week no doubt :cool:
 

Attachments

  • cable60.png
    cable60.png
    21.4 KB · Views: 247
talk about the 'kiss of death'......nice reverse off that hourly t/line this p.m. And a textbook 1-2-3 down to target as added confirm!

trades all over the shop on this thing today (long & short), with the key levels acting up accordingly.
 

Attachments

  • oct127.png
    oct127.png
    21.1 KB · Views: 243
106.20 is now support for the yen. Stong bounce Mon and today. Look at this on the 30 min or 1 hr.
This level should b tradable.
 
repetative little bleeders these lower top plays huh?

what odds for the hat-trick tomorra :LOL:
 

Attachments

  • oct134.png
    oct134.png
    16.1 KB · Views: 216
  • oct139.png
    oct139.png
    20.9 KB · Views: 228
:-0 ok, so maybe not a bona fide 'hat-trick' of consecutive daily Cable 1-2-3's as such.......but it was a higher low :?: :)

and turning off a key round number.....so, maybe an "assist" ;)
 

Attachments

  • oct143.png
    oct143.png
    26.8 KB · Views: 204
Yes, very tradable double bottom there, and then 1,2,3. Don't know if you were watching the action, but cable really didn't like those low levels at that time. An interesting market juncture.
 
yes, not only was it a 50% hourly Fib bounce - but an area of prev resist from last Wed/Thurs (20th - 21st) also the high/close level of the 20th....so, as you say a pretty tradeable juncture.....they're a favorite pattern of mine with generally, consistant hit rates. Combine them with a key round number & other confirmers (Fib/Pivot etc..) & you usually have low risk/high probability set up.

In fact a similar pattern played out on the 240min during Wed (off the 8450 top), which formed a dble top on the hourly......and the target area (8180) of that larger time frame set up, actually provided the reverse set up of the one I traded y'day :D this t/a works in strange ways occasionally huh?
 
:LOL: :LOL: talk about 'buses'......it's like Oxford St on a Sat afternoon..........15min lower Fib bounce, key round number reaction - and back to the Asian highs........ :rolleyes:
 

Attachments

  • oct144.png
    oct144.png
    12.6 KB · Views: 219
:LOL: yeah....am still holding a position from the earlier pop this morning ( stop on the final lot - just below the 295 entry) to test the resiliance of this support area....but yes, it's holding up atm.....actually, shorting off this Asian top was also a good, low risk entry back to supports!
 
Top