Novel use of Moving Averages

FetteredChinos

Veteren member
Messages
3,897
Likes
40
Ah yes, friday, the day of long boozy lunches, if only every day was like this..

anyway, my workshop has been busy, and decided to air another system in public.

again, it is one of my silly monthly settlement methods, but with a few filters in place to reduce duff trades owing to seasonal variations etc....zzzzzzz....

here are the stats...trading the FTSE end of day (untested on other indices, but seems to work ok-ish on GBP/USD)

Points 40483.72
Trades 1148
Wins 684
Win % 59.58%
Average Win 52.06
Average Loss -28.41
Profit Factor 1.83


and now the rules:-

put up a 10 SMA and a 20 SMA on your charts....

then if the daily close is above the higher of the 2, then sell at the close. (or as near as)
if the daily close is below the lower of the 2, then buy at the close (or as near as)

take the trades cumulatively, and close all positions out on the first trading day of the next month.

dont take any trades in august or september (this is where curve-fitting could be a fair accusation, but since 1998 these two months have a net loss of some 8,000 points or so. this is probably statistically significant)

the idea of not trading when the price is between the SMA's is to filter out the breakeven trades (i did a quick tinker, and those days that trade between the two end up with a slight net loss after costs. therefore makes sense to remove them from the strat)


i'll do some further tinkering avec le Dow when the Stella has worked its way through my body.....


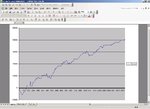
spreadsheets and equity curve to follow.


FC
 
show me the way to go home......
 

Attachments

  • equity.jpg
    equity.jpg
    76 KB · Views: 871
hmm, seems to work ok-ish on the Dow.

equity curve a little on the scary side, but still hugely net-positiive.....


this is with the same parameters. havent tried to optimise the MA settings either..

also, removing august and september has a largelyt psositive effect...

FC
 

Attachments

  • Dow Dow, Deeper and Dow.xls
    734 KB · Views: 805
FetteredChinos said:
also, removing august and september has a largelyt psositive effect...

FC

Hmm.. May I suggest you put more tonic in your lunch ? :)

Seriously, good stuff FC.
Another weekend to spend dissecting this strat.
 
no worries.

found a modicification that makes it both simpler, and still comes up with similar results..

simply fade the close versus 1 moving average. periods from 10-30 seem to work best, which impliers a certain robusterness.

i may post a sheert later.

fc
 
The key advantage of these ideas seems to be that they are EOD strats, thus allowing traders to try out the ideas without risking leaving ther jobs.

Is that your mindset, FC ?

I wonder if the advantage of being in front of a screen really gives any greater financial advantage.
I seem to have found an affinity for FX gbpusd, but I lack the patience to sit around waiting for something to happen.

Do you find the "place an order and go then forget it" strats productive ?
 
yup trendie. thats precisely the idea.

my aim is to try to become a professional golfer (current handicap about 10-14 ish) and with enough practice im sure i could get down to scratch, or better.

as a result i need to get practising, yet still be able to fund day to day existence.

hence trading..


gotta have a dream, gotta have a dream.


just ask kevin costner.

fc
 
excellent spreadbet strategy

a few years ago this strategy would be impossible but for the well heeled. now with spreadbetting, this is a quick way to a huge drawdown, some over the weekend woes, a head splitting ache of regret, and a few pennies in your pocket at the end of the year.

i like it!

no targets eh?
 
nah. course not..

this was just something that i discovered by tinkering around. i agree that that it requires a hefty account, and intra-trade drawdowns are likely to be huge, but i was surprised by the way it worked..

i attach a sheet which simplifies the method. no other parameters other than:-

if todays close is greater than the 10 period SMA then short at the close
if todays close is less than the 10 period SMA then go long at the close

close all open positions on the last trading day of the month.

seems to average approx 400 points per month..

trading at £1 per point with a £5000-£10,000 account represents a decent enough return.

consistently profitable over 7 years. i think thats a reasonable method.

obviously it can be improved. but the basic method seems sound..

FC
 

Attachments

  • Fading MAs.xls
    651 KB · Views: 710
Last edited:
Thats a LOT of points

ok, i know it is multiple contracts etc..

but rather than closing out the trades at the end of the month, look what a more "dynamic" exit strategy can come up with.

this isnt the best i have discovered, but it is still a huge improvement on the previously posted sheet.

win rate is also looking healthy. but that is probably due to the lack of stops involved in this strategy.

again, a sizeable account needed to trade this fella, but hey, it works (at least in theory)


Entry rules:- same as a above:- if closing above the 10 period SMA go short, if closing below, go long. Multiple positions can be held at any time.

Exits - now this is where things get complicated, and probably needs a spreadsheet to keep track of them.

Short exit:- todays close is below the low of the previous 4 days. close all short positions, leave the longs open

Long exit - todays close is above the high of the previous 4 days. close all long positions, leave the shorts billowing in the wind.


stats using this strat are:-

Total points 77258.92
Trades 1647
Wins 1260
Win % 76.50%
Pts / trade 46.91
Average Win 97.58
Average Loss -118.07
Max days held for short 33
Max days held for long 31
Profit Factor 2.69
"Drawdown" 7792.6


again, trading this with a large account looks like bagging 40pts a day or so on average.

again, maximum stress levels are to be associated with such methods, as pointed out by mezarashii !!!

hope this idea triggers a few thoughts....
 

Attachments

  • NON TIMED EXIT.xls
    1.2 MB · Views: 515
Great stuff FC......

Is there some way of telling from the SS how many positions are open at any time (I may be missing the obviois here?) in order to calculate the ammount of "capital employed"?

On a more general note, I love to study the systems you share (and big thanks for sharing them) and was wondering, do you trade any of them? If so, what measure do you use to decide which ones to trade?

Cheers,
UTB
 
Help Please

FetteredChinos

I've built a number of models in the past, none of which could be tinkered with (by me anyway) to show a cumulative profit. So I was very interested to have a look at your system. Need some help here:
1. SMA column is 23 period not 10 period average.
2. "Short Exit" formula takes the next day's value not the previous if the condition is FALSE.
3. Likewise for "Long Exit".
4. "Short profit" seems to be accumulated for every day its open rather than when it is closed and I don't see how multiple open positions are calculated. ( was expecting some sort of average entry price).

Can you explain? I'm happy to help fix if these are errors rather than my misunderstanding.

Cheers
 
now worries guys, thanks for looking at this...

gcb, in response to your questions...

1) agreed. whoops. i was tinkering with different SMA periods. if you change the number of periods, pretty much anything from 10-50+ yields a profit

2), 3) & 4) the exit formulas are my way of trying to code multiple postions at once. look at the numbers, bearing in mind we are trying to exit at the first match of the exit criteria.

eg the first time we hit the short exit criteria is 23/1/1998 at 5181.4

each time we meet an entry criteria, as displayed in column M, then i take the direction of the trade. and calculate the difference between the entry price, and the price when we first meet the exit criteria, which is displayed in column N.

same goes for Long entries.. just have a look at the numbers, rather than the formulae to see how it kinda works.

to use my previous example, on the 16/1/1998 we went short at 5263. this then exited at 5181 on the 23 for 82 points (column P)

then on the 17/1/1998 we added another short position at 5273 and also exited at 5181 on the 23/1/98 for 92 points (column P)

the cumulative position for these two trades is shown in column S and stands at 173.9

there is a bit of artistic licence with regards to the cumulative positions being showin, but it is there to simplify the calculations, otherwise we would end up with even more columns than we have already.


does that help?

FC


ps, i havent started trading these as yet. am gonna fwd test for a while. to verify my results on various new strats

i havent got the time to trade fully at the moment as je suis tres occupé au travail a ce moment.


roll on summer.

FC
 
further to my earlier post about which system to trade, this is the one that is at the forefront of my thinking and is based on such a simple entry criteria it is a joke..

Total points 31658.64
Trades 536
Wins 413
Win % 77.05%
Pts / trade 59.06
Average Win 107.04
Average Loss -102.01
Max days held for short 33
Max days held for long 31
Profit Factor 3.52
"Drawdown" 2265.2


im not going to divulge this one, until i come up with something a lot better...

what most appeals is the profit factor.. one of the highest i have come up with so far :)

fc
 
FetteredChinos said:
further to my earlier post about which system to trade, this is the one that is at the forefront of my thinking and is based on such a simple entry criteria it is a joke..

Total points 31658.64
Trades 536
Wins 413
Win % 77.05%
Pts / trade 59.06
Average Win 107.04
Average Loss -102.01
Max days held for short 33
Max days held for long 31
Profit Factor 3.52
"Drawdown" 2265.2


im not going to divulge this one, until i come up with something a lot better...

what most appeals is the profit factor.. one of the highest i have come up with so far :)

fc

FC,

Just a thought about the stats you use - don't you need to consider the ammount of capital employed (even if it's an average) with each strategy?

Would you trade the above system if you had to use "£100K"?

I like to consider the drawdown as a % of this figure and also consider what would happen if somebody nuked London - historical drawdowns can't predict this of course - but I'd be more comfortable with exposing say £10K than £100K

Regards,
UTB

PS - Your ability to stick at these systems without trading them is impressive. I always have to have money at risk to develop them further - but I know which one of us is the more sensible.
 
Last edited:
if somebody nuked london, then the least of my worries would be the status of my trading account.

that is how i will always view things.


the plan as i have stated before and elsewhere is that i am trying to develop a simple strategy that enables me to check prices once a day and act accordingly.

the strat whose stats i posted just now enables me to do that. literally all it needs is 3 numbers, 2 of which dont really change that much, and the other is todays closing price.

i will look into coding stops into it. i think i had a brainwave on the tube this morning (was there a nuclear attack?) about how to code multiple stops into these such strategies.

bearing in mind the max loss over the last 7 years has been 600-odd points. i would have thought a 300 point stop at a guess would be a fair stop (need to verify this) which is nothing particularly loose for medium term positions.

roger,

FC
 
FetteredChinos said:
if somebody nuked london, then the least of my worries would be the status of my trading account.

FC

LOL - can't argue with that.

But if your future depended on needing £100K to trade your golf course strategy and you only had £10K, this might be somewhere higher up the list of worries?

UTB
 
Last edited:
hmm agreed.. i see where you are coming from..

from what i have looked at. my revised strat only has a maximum of 12 short positions open in one direction at one time...and 11 long positions..

these would probably net each other out at some point (havent checked) so i would be surprised to see if my net exposure was more than 10 positions in a particular direction.

£10k would probably be enough to trade this comfortably..

at £1 per point conservatively, thats £20 per day fairly reliably. not much, but thats enough to double your account every 18 months or so...if you trade a variety of instruments to spread risk (it does seem to work on most indices apart from the DAX. buggered if i know why) then you could trade slightly larger position size.

FC
 
Alternative

FetteredChinos

I'm afraid my simple brain can't cope with the logic in your spreadsheet. I've reworked it to use average prices so that as a trade is added to there is only one price to keep track of. Good news is the total points are even better ( 84,592.22 ). However, one of the reasons for changing the calcs was to see if there is anything nasty lurking around. Sadly there is. The worst day is 21/9/2001 where I reckon that on the day's high/low it is down 12,830.5 points (I haven't worked out the margin requirement). Now in terms of the system it is ok because the cumulative capital by that point is excellent and (assuming it has not been spent) would absorb that no problem. Incidentally that trade closed with a much lower loss.

I reckon the max number of bets open is 29 with the maximum net (longs-shorts) -27.

I am trying to see how to avoid the worst losses or at least stop it getting so bad but, as ever, adding stops hits profit.
 
Top