FetteredChinos
Veteren member
- Messages
- 3,897
- Likes
- 40
Ah yes, friday, the day of long boozy lunches, if only every day was like this..
anyway, my workshop has been busy, and decided to air another system in public.
again, it is one of my silly monthly settlement methods, but with a few filters in place to reduce duff trades owing to seasonal variations etc....zzzzzzz....
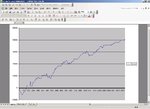
here are the stats...trading the FTSE end of day (untested on other indices, but seems to work ok-ish on GBP/USD)
Points 40483.72
Trades 1148
Wins 684
Win % 59.58%
Average Win 52.06
Average Loss -28.41
Profit Factor 1.83
and now the rules:-
put up a 10 SMA and a 20 SMA on your charts....
then if the daily close is above the higher of the 2, then sell at the close. (or as near as)
if the daily close is below the lower of the 2, then buy at the close (or as near as)
take the trades cumulatively, and close all positions out on the first trading day of the next month.
dont take any trades in august or september (this is where curve-fitting could be a fair accusation, but since 1998 these two months have a net loss of some 8,000 points or so. this is probably statistically significant)
the idea of not trading when the price is between the SMA's is to filter out the breakeven trades (i did a quick tinker, and those days that trade between the two end up with a slight net loss after costs. therefore makes sense to remove them from the strat)
i'll do some further tinkering avec le Dow when the Stella has worked its way through my body.....
spreadsheets and equity curve to follow.
FC

