'No indicators' revisited

My stop would be just below the previous bar, and I would be raising it as each 10 min bar is formed.

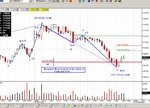
So the last 10 min bar is 1112.75 to 1113.75. So whatever entry you have here, you'll know within 1 point if you are wrong.

So in your example my stop would now be raised to 1112.50 for a tight exit. Note that there is a doji on that bar too - often a sign of reversal.
 
The fresh air is now 0.75 points, which is quite weak.

If the price continues down after the 10 min doji, then expect either a double bottom, with a nice quick bounce, or continuation down.

Take a look at the Dow - there's no fresh air there now, so looks as if the Dow may pull ES down.
 
Useful stuff as ever Skim, thanks for your time.

Deleted my last post as I realised my inconveniently sized chart was also criminally polluted with indicators. Eeuw.

However I cannot resist mentioning that the first top of the double top at 1118 was preceded by a lovely Tick/Tick MACD divergence, then on the second top a clear ES/Tick divergence. I still have faith in this setup, though I must admit stealing the essence of it from the great China White. And the RSI? Recently Spurned Indicator!

I think the morning gap may tempt the ES into filling it, which would pull the price down to 1109 (yesterday's close and also a pivot point). If the current consolidation 1112-1114 breaks to the downside I think the target is about 1108. So, a limit buy at 1108.5 with a stop at 1107 is perhaps not a ridiculous proposition.

Back to watching those 10 min bars tick away. Starting to notice that if a bar is trying to break the high of the previous bar and it pushes at the top a large number of times without breaking higher then the bar is apt to go lower. Vice versa for lows. But if it takes only a few pushes to make a HH/LL then the buyers/sellers are more obviously in control. Is this at all correct?
 
Frugi - sorry forgot to mention - since it is (5,35,10) setting on 5 min and thez no "after-hours tick", macd readings over first 50 min r not reliable. so it was just tick neg div at upper pivot with neg divs across indices - that'd be the system's logic for S at about 1117.50. Apologies to the dark side for bringing it up here! :)
 
I was thinking more of the great white shark, cruising the high seES and gulping down huge amounts of daily points, while the smaller fish such as the Frugi are happy to catch just a few tiddlers, at least until they've grown bigger, faster, and more at home in their hunting territory. :cheesy:
 
China,

Thanks for the MACD advice - I'd forgotten about unreliable early signals.

However as I'm using 2,20,10 on a 2 min chart perhaps I am allowed to count divergences a little earlier than with your 5,35,10 on the 5 min. Either I should wait 20 or 40 minutes for a reliable signal but I admit I'm not sure which.

You also say there was ND at the upper pivot which suggests to me Sierra is drawing my pivots incorrectly, or at least by another method.

I've got (from bottom to top) approximately 1102, 1106.25, 1109, 1113, 1115.75. Sierra is meant to calculate them from yesterday's data (daily chart, excl after hours). Are you using a different method to calculative your pivots?

Sorry to be a pain.

Edit: Ahh maybe you meant R3 at 1118.25 which I hadn't drawn on till now?
 
1st time in a while res/sup resolution severely pierced

well hope this qualifies for the dark side :cheesy:

for quite a while I am seeing former res/sup resolved to the upside well pierced to say the least. IMO today's close will be crucial.
 

Attachments

  • cme15 minute.jpg
    cme15 minute.jpg
    47 KB · Views: 596
fru mate of coz with yr settings it's entirely legit :)

what i mean by pivots i am using is just 1st hr lower and upper pivots. I trust more the low and high of the first hour than some "computed" numbers - no knocking them off intended :)
 
Some great stuff here, not sure I'm totally ready for the dark side though, but I do often trade with just the 34 ema. Usually use some cci as well though. But tonight was a great example of waiting until 14.00 EST and then taking the first decent signal whatever you do - for price only trading there was a break down on the 14.15 bar. 3 min CCI gave a signal at 14.06, whilst there were the double tops and stuff earlier, 34 ema contained 5 min price all along.

Waiting for that first decent signal after 14.00 has been great over the past few months - we have been stuffed with small ranges etc over lunch time so unless you are extra keen, it's best to leave 12.00 to 14.00 alone. Hopefully though we'll get some more volatility in the new year with more follow through on some of these moves.


regards, java
 
To bring it back on to price only :D

There were some excellent examples of geometric measured moves based on the Cardinal ratio's of sacred Geometry :cool:
See the opening price bar support in action again....
The 10min ES04H.......

Cheers CJ
 

Attachments

  • asicme-es04h- 10 minute.bmp ratios.jpg
    asicme-es04h- 10 minute.bmp ratios.jpg
    157 KB · Views: 582
Last edited:
some sketches if I may

the latest res/sup resolution level failed, the previous one held (barely) - green line.

2 scenarios which will be resolved on monday when the volume comes back - imo :cheesy:

1) either 1105 res/sup resolution level will hold and today will be treated as a holiday non-event - but in this case 1118 (HOD) will hv to be taken out rather quickly

2) depending on what u define as the latest thrust up for Fib analysis (i drew two possible ones- Fib A and B), if 1105 cannot hold - it is 1083.5 that I'll be watching. It is 38.2% retracement in Fib A and 50% retracement in Fib B AND itself a former res/sup resolution level. Possibly even a 10 point band btwn 1073.5 and 1083.5 - Fib levels as well as res/sup resolution levels.

I personally think that 1083.5 wud be the best correction for the bulls to keep chugging on but - we need volume to see.
 

Attachments

  • cme60 minute.jpg
    cme60 minute.jpg
    47.4 KB · Views: 523
theres a tendency for the little guys (fully paid up member) to use charts with shorter and shorter timebases. I suppose we all think we might see a signal a little earlier.. but usually leap out of a trade at the first reaction of 'noise'.
Can anyone shed any light on what the pro's usually watch.. afteral, it can't do any harm watching the same charts as the big boys.
I realise everyone is different, but what will they be watching for a hold period of 5 to 60 minutes.
 
Cigar - when i traded spooz as a pro I watched mostly daily, hourly shortest - but i am no good advice on this as i was an option trader on the index and for the purposes of volatility trading daily is the shortest sensible interval. Even what the pros call "day trading" is not what we daytraders :) here do. I'd say hourly as the shortest.

do not forget that even pros tossing around futures when they r losing money on options to make up for their P&L r in a very different game. when i meet up with my ex-colleagues :) for a p1ss-up and start talking about tick divergencies :) they reckon i picked up a new foreign language :)
 
I have absolutely no experience of what charts pros watch.

But the turns in the market often coincide with the o'clock, and half past the o'clock. So I would take a guess at 30 min and 60 min.
 
a320:

You're right ... they do keep trying to slip the odd indicator in here and there, but they won't win! We will convince them eventually, although it may take some time ...

Anyway, onto today. For a change, the following chart is the Dow, end of day.

Today's action formed a gap and trap bar on the daily chart. These bars form when the price rises above the previous day's high, then drops down below trapping all the longs at the high of the day.

These bars are typical of the big boys playing games, and often appear at the tops of swings, and at market tops.

Trendlines can occasionally come in handy, particularly for longer term moves, such as identifying channels, etc. Something I remembered from the old days was that a trend is unlikely to continue beyond four trendlines getting steeper and steeper.

The four yellow trendlines on the chart are drawn joining the lows, and are getting steeper and steeper. Today's price action cuts through the last of these trendlines.

So a gap & trap bar, coinciding with a break of the fourth steeper trendline. Interesting, eh?
 

Attachments

  • dow gap and trap bars.jpg
    dow gap and trap bars.jpg
    72.4 KB · Views: 659
Forgot to add something about the formation of the gap & trap bars in the chart above.

Notice that the third gap & trap bar I've shown (mid November), and today's (the last one), have the close of the day BELOW the previous bar's low. In other words, they form an outside bar. Outside bars are usually a very good reason to get out of a trade, as you can see from the depth of the pullback in mid November.
 
skim - i thot it was 3 steepening supports 2 b honest.... if i am right it'll hv 2 b a break below 10250 on yr chart to kill the bull :) which wud ruffly be 1083.5 on the spooz.... actually quite interesting, dont u think?
 
I've always done 4 supports, because those are the reasonably rare ones.

You may well be right Mr White, as there now needs to be a proper top pattern. So by the time this forms, it may well have reached your 10250 point.

The rise has been reasonably gradual, so I would go for a head & shoulders top. Today's action may just have been the head, in which case an imaginary right shoulder still to come would fit in nicely with that 10,250 break.

You're the expert on the longer-term stuff, I'm more of a short-term gal myself. :cheesy:
 
Top