'No indicators' revisited

Ok. Just 'cos you asked so nicely....The diminishing volumes on the 1 min chart , as prices make lower lows, shows a lack of interest or ability to push the price any lower..... But this goes against your theory ( which I agree with and understand) that prices rise on diminishing volumes.
I have to agree, also, that the 1 min chart ( and in particular the volume) is just too noisy. You can, too, on odd ocaisions, see blow of bottoms and tops, indicating a reversal. I just can't quite see the path through to the dark side.... :(
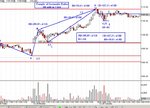
Blow off top on ES 1 min 29/12/03 chart....strangely enough, not a bad BOB as well.
 

Attachments

  • botes.gif
    botes.gif
    13.9 KB · Views: 896
Excellent Post Skim :cool:

The other thread mentioned fib/phi ratio's :cheesy:
Here an example of the of geometric ratio series and how they relate to the volume as explained beautifully by skim :D

ES04H 10min for your viewing pleasure and yes there should be an x in example..the chat room boys know I'm not the best at spelling... :cheesy:

Cheers CJ
 

Attachments

  • asicme-es04h- 10 minutegeomertry1212.jpg
    asicme-es04h- 10 minutegeomertry1212.jpg
    151.9 KB · Views: 895
Last edited:
Most investors/traders are still on holiday at this time of year so predictions about volume can be a bit volatile, good stop losses must be in order and not chart prediction.
 
Thank you Skim, Chartman and A320. These are the pointers that we (certainly me!) all need. I was wondering how it could be possible to distinguish between longs and shorts as this would surely be like having L2 and a great underlying window to the market.
More studying for young Quercus!
I'd prefer it to be in a Paua shell actually.:LOL:
Just come back from snorkeling the bay with a haul of Paua, also known as ormer and abalone. Yum yum, but nothing like carrots.
My New Years Resolution is to drop the indicators, so I have many challenges ahead I think!
Thanks to everyone for their help over the last few months - I am continually heartened by the generosity of folk on this site. Long may it continue, and I hope others have the foresight to realise that having someone tell you what to do will simply NOT work in any way shape or form! Just listen and work hard for yourself.
Best wishes to all for'04.
Cheers
Q
 
Long may it continue, and I hope others have the foresight to realise that having someone tell you what to do will simply NOT work in any way shape or form! Just listen and work hard for yourself.
Well said, young man. If more people realised this, they might become better traders.
 
Yes well said :cool:

Thank you for the kind words & all the best for new year :cool:
I see chartmans checking out this thread alot...starting to sway :?: :cheesy:

Take it easy
CJ
 
Thanks :D its just a variant on the classic measured moves as jiller explains..but measured moves also relate (move) to certain geometric ratio's :cool:

Cheers
CJ
 
Quercus said:
I was wondering how it could be possible to distinguish between longs and shorts as this would surely be like having L2 and a great underlying window to the market.

Quercus,

I think Chartman has mentioned futures Level II or DOM (Depth Of Market) previously. He might be able to gve you more info on exactly how useful it is. I had a brief look at it, as well as a globex terminal (before the advent of Globex Level II) and frankly, it did my head in.

The simplest way (though not totally infallible) method for distinguishing between longs and shorts (although clearly every trade has a buyer and seller) is to look at whether trades are gong off on the ask or the bid.

Trades going off on the ask indicate buying pressure, trade going off on the bid indicate selling pressure.

Just adding to Skim's post (not that it needs it ;)). You have to remember that every session has more or less the same profile in terms of volume, i.e. most of the volume taking place in the first and last 90 minutes. Any "divergences" you might see have to be examined in that context. That's why that last chart of Skim's is so good. More or less the only volume highlighted was that which didn't match the normal profile of the session.
 
lads/lasses - even tho i am not exactly on the dark side :) i find this thread brilliant! it is truly amazing what pool of talent we've got here! and the pros claim they r the "creme de la creme"! :) anyhow, best of luck 2 every1 in the new yr! i wish all four profitable 2004 expiries! :)
 
Quercus,

As an aside. Skim is obviously correct when she says that books/articles that refer to volume confirmation/divergence patterns in reference to futures are incorrect.

This is because:

1) A huge proportion of volume on the stock index futures is accounted for by index arbitrage trades.

2) Of the remaining volume on the ES a large proportion of the volume (although not as much as used to be the case) is accounted for by arbitrage between the large and small contracts.

Having said all that however, I do believe that understanding volume and order flow can do more than anything else to improve your trading. I just don't believe that monitoring ES volume on charts helps that much (with one exception which I'll cover at the end).

To clarify:What I mean by understanding volume/order flow is scouring through the time and sales for days or weeks of pit traded S&P sessions whilst at the same time browsing the corresponding charts (all T&S is down loadable from the CME for free). Try and piece together who did what/when and what "real" volume was associated with certain moves.

You should be able to get to the point where you can look at a chart of the ES and know with reasonable certainty where the orders are going to be placed and therefore where the volume is going to occur. You should also obtain a much better idea of "when" volume is like to appear.

Then you get to the point where monitoring ES volume can be useful. If you think there should be volume when you breach a certain price level and there isn't, then that's useful. If you don't expect volume at a certain price level and there is, then that's also useful.
 
Last edited:
Thanks for that Sand - it all adds fuel to the fire!
Can't imagine I'd have enought time to see if people are buying the ask or selling to the bid though! :eek:
Your comments about start/end of the day make REAL sense.
Cheers
Q
 
I may be swaying , a bit, 320, but to me, ( no disrespect) your chart look like a waychart....totally appropriate, don't you think? :cheesy:
 
Quercus,

A simple way of doing it is using a time and sales window in your charting package and colour coding it so that the trade price is displayed in red if it's at the bid or green if it's at the offer. You can certainly do this with thing like Q-Charts.

Just remembered. There used to be a little add-on (free) to Q-Charts called trade-tones that you could set to play different sounds when the bid or offer was hit.

Market-Voice (unfortunately only available through the cme now I think) was also a much cleverer extension of this.
 
Last edited:
I thought it looked some what familiar :cheesy:
Its been a long time since I've drawn fan lines for drift corrections :confused: ...the joys of dead reckoning..give me an INS any day ;)

Cheers CJ
 
Last edited:
At least if the electronics goes belly up, you'll still be able to get to B from A.... :cheesy:
 
Adding to what Sandpiper said, the way I use to know whether longs or shorts are in command is to watch the tick - the wibbly wobbly end to the bar being formed.

With practice (hours and hours) you can easily know what is happening, who's driving the market (whether retail boys or big boys), etc, simply by noting the tick formations within the 5 minute bar.

But we digress. Volume is just the icing on the cake, accounting for perhaps 10% of trade decisions. By mastering the price bar action you are 90% there. So don't waste your time worrying about volume, until you've got the bars cracked. :D
 
Shimbleshanks

spot on re price bar. When price bar is rising the first few minutes of the new 5 min bar tends to be down once the trend is underway. You think it is time to close but in the last couple of mins of this bar you will often see the price spring back and know that the bulls are winning. Same for a donwtrend.

Early in a new trend the price bars are stronger for the trend in the first few mins of the 5 min bar and will continue to move in favour of the trend. The watching of the price movement within the price bar over 5 mins is useful for remaining with a trend during its 2nd and 3rd stages. IMHO

I should add I have only used this on the FTSE but I would guess this works on other instruments.
 
When watching the tick on the price bar, the one to be very wary of is the fast movement within the last 30 seconds of the 5 min bar - this is the big boys getting into position, and often shows as a spook out bar which leaves all the little retail boys with their stops hit, and the price rockets off in the opposite direction.
 
Top