china white
Established member
- Messages
- 979
- Likes
- 12
Rustic1, I believe u can just open a new window in QCharts for Dow futures and create the volume study, just like ES.
clylbw said:Hi,
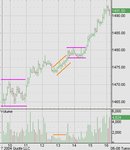
First of all, I have been told that some of the charts I attached were not clear enough; I am really sorry for the confusion. The chart attached in this post is the 5-minute chart of today's NQ; the first bar started at 9:30am EST when the market opened, and the last bar indicated the market's close at 16:15pm EST. The hours of the day are indicated in the x axis. Hopefully this chart is clear enough.
I would like to ask three things about today's NQ actions.
1. SOCRATES, can you (or others) please tell me whether you would think the periods between 9:30 and 11:00am, and 13:35 to 14:40pm, both highlighted by pink horizontal lines, as accumulations? During both periods, the price travelled within a range, but the volume in the afternoon period was much lighter than that in the morning period. I have heard that accumulation takes place with light volume; is light volume a necessary condition for accumulation?
2. I wonder how to interpret the period between 12:55 and 13:25pm, when the price increased in apparent light volume (both the bars and the corresponding volume are highlighted by orange lines)? I was long at that time, and a bit concerned as volume did not seem to support the price movement. Fortunately later prices and volumes invalidated such concern.
3. Do other Dark Siders look at the Time&Sales information? Sometimes I find it confusing. For example, I have seen more than once large quantities such as hundreds or even thousands in bid/ask, but the actual trades are only in tens and dozens. I wonder whether people are playing games at GLOBEX as they would be doing in NASDAQ Level II.
Thanks indeed.
BTW, china, I hope this post does not clash with your daily volume analysis, which I have enjoyed a lot. 🙂
china white said:lads/lasses - just an observation here - look how on strong trend days Lynda's "holy grail" gets validated and "endorsed" by price-volume dynamics. I must say NOW I really see why the grail actually works - and is not just some "mechanical" trading rule...... dark side is truly amazing 🙂
china white said:lads/lasses - just an observation here - look how on strong trend days Lynda's "holy grail" gets validated and "endorsed" by price-volume dynamics. I must say NOW I really see why the grail actually works - and is not just some "mechanical" trading rule...... dark side is truly amazing 🙂
TheBramble said:China - continuing thickness on my part I'm sure.
What is 'Lynda's Holy grail' that you're referring to?
DrBungle said:Hello and thanks again to everyone for excellent contributions.
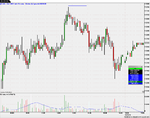
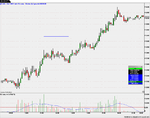
Attached are pictures from yesterdays (7th) and fridays (4th) trading (ES 5 min). On both charts there is a bullflaggish formation, marked with a blue horisontal line above the formation. On friday it turned out ot be a reversal, yesterday a continuation pattern. Any ideas how one could have been able to differentiate between the two in real-time? I know it probably has a lot to do with context (what has happened before the formation) and also with what happens during the formation.
Any input greatly appreciated.
Bungle
BKuerbs said:This thread is called "No indicators" and so my comments may be considered to be not valid. But I do not put $Tick and the Advance/Decline line in the same league as MACD and RSI.
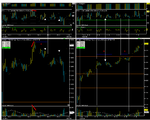
Compare the behaviour of volume and $Tick at the beginning of area A and B. In A, ES rises on declining volume and declining $Tick while in B volume rises, though a bit too much. During the declines there are differences too: in A $Tick moves down below 0 and ES moves down too. In B, though $Tick moves down, it does not drop below 0, and though ES does follow, it drops only much less than in A.
From the start of the each session, there are differences: ADD is strong on both days, but stronger on Monday. On Monday, $Tick only once touches 0, but else stays positive.
C is a repetition of B. Though $Tick drops, ES rises. You have to look at the COMP index too, because ADD and $Tick actually reflect their behaviour, not that of the SPX (ES).
regards
Bernd Kuerbs