'No indicators' revisited

Lurking

firehorse said:
I was hoping my comments would help point out if I was reasoning correctly or imagining things wrongly. I thought I would learn more by posting than by lurking so I posted! :)


We are very pleased you have stopped loitering on the balcony and come down and posted.
You have made a very worthwhile stab at this, I shall be expanding on this later.
At this juncture, I would like to say to all fellow darksiders that our 24 hour curfew was the
right thing to do, you see how the idea winkles out ? Curfew ends 1300 hrs. Thanks all.
 
firehorse

Looks like you passed the first test - you didn't get slayed!

Regards

bracke
 
Yep, i now use multiple timeframes to trade following on from post 872....30 mins for the bigger picture and 10 for entry.
 
bracke said:
firehorse

Looks like you passed the first test - you didn't get slayed!
Phew! :LOL:
SOCRATES said:
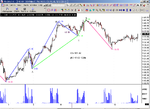
In the 6 minute chart displayed above, in pure supply demand terms, the two big volume bars do not look right, that is the visual problem. This visual problem may prevent you from being certain of the most likely direction the action would be likely to take. This is because you are too close to the action to be able to see the whole picture. I will expand further.
This echos what CW was explaining before.
china white said:
NOW THINK ABOUT THIS: a maribozu up on heavy volume in a given 2 min interval followed by a maribozu down on a heavy volume over the next 2 minutes = a doji on a heavy volume on a 4 minutes interval!!!!!!! IS IT CLEAR NOW HOW THE CONTEXT IS KEY?
I think many people just read the chart (like me :) ) without being able to interpret the chart like that! :) ... yet :p
--
Alan
 
In addition, which is a point I omitted to make clearly is that the two volume bars originally discussed above when ABSORBED whin the contiunuity of a larger timframe chart become INCONSEQUENTIAL
within the context of the overall move, that is an ADDITIONAL VALID REASON why you should not get stuck in a particular timeframe UNTIL YOU HAVE A COMPLETE GRIP OF UNFOLDING MARKET ACTION,
and not before !
Bramble pay attention, please !
 
Last edited:
This is my 30min ES #F chart ...
 

Attachments

  • EW35.png
    EW35.png
    42 KB · Views: 324
a320 said:
This is my 30min ES #F chart ...

There is nothing wrong with the record of price progression,
but the volume progression is to say the least, wonky.
This is a data collection and display imperfection.
 
a320 said:
Only posting it show price analysis ;)

OK this is a bull phase clearly showing 1:1 etc., and the number 3 is very important also,
and I know exactly what is your posture and your methodology, but I am trying to wean the
audience away from scaffolding and harness, ratios, etc., to give them a chance to develop....
And by the way I can see you and I can read it with rogue data and other rubbish in the way and even without volume, but give me a chance to try to develop them further.....
 
Last edited:
SOCRATES said:
And by the way I can see you and I can read it with rogue data and other rubbish in the way and even without volume, but give me a chance to try to develop them further.....

OK ;) :) :cool:
 
seomaster,

I presume you're talking about Qcharts? I just checked their website and it says Unlimited symbols & charts.. that should answer your question. ;)
 
Price Studies

a320 said:

Hello, The Official Court Jester to the Supreme Assembly of Darksiders
is also very interested in Price Only studies. I have told him he has to
wait as this thread is developing very well, and I have promised him
I shall be dealing with this topic also, later. But first there are other
priorities that have to be dealt with.
 
;)

Bosch & fools...

Allegory by Metsys also springs to mind..
 

Attachments

  • Bosch.jpg
    Bosch.jpg
    20.3 KB · Views: 247
  • ship of fools.jpg
    ship of fools.jpg
    59.4 KB · Views: 223
Last edited:
SOCRATES said:
Hello, The Official Court Jester to the Supreme Assembly of Darksiders
is also very interested in Price Only studies.

Can you be sure the Jester is not a fool???
Only with the help of the poet Rabelais , one can decipher.

Personally I prefer Epoptic methods, but this Mystes example follows the recent tone.

I don the cap of Arimathea depicted by Blake . :eek: ;)
 
a320 said:
Can you be sure the Jester is not a fool???
Only with the help of the poet Rabelais , one can decipher.

Personally I prefer Epoptic methods, but this Mystes example follows the recent tone.

I don the cap of Arimathea depicted by Blake . :eek: ;)

No he is not a fool. He is a very entertaining chap and we are all very fond of him.
He is straining at the leash for more information, which is a good virtue.
But all these things are structured and he has to wait. I have promised I will help him.
It is just that inadvertently you were not privy to the appointment conferred upon him, owing to his cheerful manner, clowning, and naughty habits of roaring around on motorbikes startling everybody.
 
SOCRATES said:
and I know exactly what is your posture and your methodology
.....

Just seeing how deep to want to go regarding the source of my methodology.... with reference to posts 573, 969 & 970. :) ;)

Good post Rognvald.. Rabelais is a master of Green Language, it is probably best keeping his work off open boards... as you say ;) :eek:

CJ
 
Last edited:
china white said:
Clylbw - what Socrates said is very sage - and makes perfect sense, that is exactly how big operators work. Not JUST on price btw - it is also a very common practice in trading options, when e.g. volatility skew explodes and big long put operators "cool down" the volatility on the downside - u get this period of both "healthy" volume and open interest on listed option with the volatility on that range of strikes sort of stuck - not going anywhere. Think abt it - it is all human nature games (with LOADS of ducats at stake) - btw this is why in all honesty I am so fascinated with the dark side - which bases trading decisions not on some mechanical indicator (no pun intended :) ) but rather on realisation of what wud the crowd ruled by greed and fear do under circumstances.

let me think out loud here :) and explore why particular price-volume patterns work so well in relation to UNDERSTANDING what they mean in terms of sussing what the crowd is doing. PLS NOTE - I will be very simplistic here - U ALWAYS HAVE TO VIEW THESE PATTERNS IN CONTEXT!!!! as stand-alones they may be VERY deceiving. Let us c - I will explore the bullish case:

a) Up maribozu on miniscule volume
b) Up maribozu on heavy volume
c) Doji on miniscule volume - or as in your Part 2 - steady but not too quick rise on little volume
d) Doji on high volume.

Let us think carefully - what do those mean?

a) price moves miles without any "resistance". What is it? NO ASKS IN THE BOOK LOG! Cavalry full gallop without a sign of the enemy! :) It is NOT the most common pattern - e.g. it happened in the first minutes of the fall of 1929, when ppl were happy if they cud cancel their bids before they got hit. It is most likely the consequence of some major news or something of that sort. Yes, usually it is the beginning of some major move, but beware, it can be a trap - there can be heavily fortified "trenches" 20 miles further along the cavalry's advance :)

b) unlike previous "unhealthy" bull move this is most likely a "healthy" bull move - loads of bulls, strong resistance by bears, but bulls outnumber the bears and take the upper hand in heavy fighting (Battle of Kursk if I may be excused for repeating the analogy :) ). HOWEVER CONTEXT IS KEY and I'll show why next.

d) (I am skipping c) for the time being). Heavy fight with price going nowhere. What does that mean? Obviously heavy buying meets heavy selling but what does THAT mean? 2 things - either as in your Part 1 the bulls r "colling down" the market after a big move OR bulls closing their longs and a potential reversal. NOW THINK ABOUT THIS: a maribozu up on heavy volume in a given 2 min interval followed by a maribozu down on a heavy volume over the next 2 minutes = a doji on a heavy volume on a 4 minutes interval!!!!!!! IS IT CLEAR NOW HOW THE CONTEXT IS KEY?

c) most probably your part 2 mate with the volume being the 2nd violin (consequential volume).

fascinating isnt' it? :) For me personally loads more informative than finding out what the formula for calculating MACD(5,35,10) is :)

Hi china,

Thanks really for all your help; it is an excellent post :!:

Sorry for not having read it until now. I have been busy for a while, and did not get around to read the posts until now. Thank you so much for your knowledge. :)
 
Top