bracke said:
SOCRATES
"This has to dip again before it can go up again, if at all."
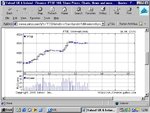
I attach to-days chart of the same instrument. It does not appear to have dipped before it went up.
Would you care to comment please.
Regards
bracke
Yes, it is quite simple really.
Looking at what continues from the last price action, you remember was a combination of
hi vol and bars repeatedly on narrow spreads closing in the middle or thereabouts.
It now turns out that by just doing the above that was enough to make the herd nervous,
and to persuade them to be prudent and for them to tighten up their stops. Of course the
consequence of tightened stops is that they are easily hit.
To put it in plain laguage this is accumulation that has turned out easier than anticipated,
that is why there is no need to dip the price down any further in order to achieve the desired
result.
This is sufficient "ammunition" if you like to carry on. Observe that the first few bars in the chart are narrow spreads also but the vol is lo. This is because the use of time has been changed, i.e., it has temporarily become a waiting game to see if more can be acquired without disturbing the market unduly by lowering prices drastically to encourage the herd to part with any more.
Aa this ploy does not succeed,now the use of time is altered and more urgency given to the objective, i.e., to take the price up during distribution. Here the vol changes from being consequential to being causative. Prices go up and up in steps from then on as the herd become converted to a bullish posture.
Now the tilt is northerly. No one is interested in lower prices except to buy more ~ opportunities
to do so become more and more scarce and prices continue to rise.
Do you see or not see ?