'No indicators' revisited

china white said:
i cannot believe it took me 5+ yrs to start seeing things so clearly..... darksiders, I am not just thanking u, I am bowing here :LOL:

You also need to thank yourself - for having an open mind, and for realising what was actually being pointed out to you. You then taught yourself to 'see' rather than just look, and by explaining it you're also teaching yourself. So you've done all the hard work, and now you're able to see things that only a special few can - and it's quite quite magical!
 
Clylbw

hope u dont mind if I butt in :) I always watch heavy weight stocks before their announcements and/or earnings. So do I oil futures as of lately :)

on a more general note, I hope u dont mind me posting such lengthy posts. it is a new thing to me and I am trying to make sure I am thinking right. PLS PLS WHIP ME IF I **** UP SOMEWHERE!!!! :) it's the only way to learn :)
 
Hi china,

I have enjoyed your 'lengthy' posts, thought I must admit I ignore the indicators on the charts :cheesy: .

Hi SOCRATES,

Am counting on your advice :). I may finally make the decision to buy another much needed monitor though as with the one and only monitor I am currently using, it is already congested enough without the charts of the stocks :rolleyes: .
 
Clylbw,

what I do - I created my own table at www.earnings.com, if u want u can use my user name "vonhilliard" and password "felicidad1" to see how it works. keeps u on your toes regarding big announcements and econ numbers.

Skim - many thx! it is magical indeed - like an open book really :)

Separately, I think I shud mention one thing which may be confusing regarding volume readings. It is perhaps what Socrates refers to as Rogue volume. Imagine an OTC options operator has to hedge 400 futures on his OTC derivative trade with a client (say on a zero cost collar as an extreme case). he may be paid so well on his volatility pricing that he prefers to hedge in one go, without working clips to skim off on the hedge a bit. U'll see those futures banged in - whih may be totally out of "market" picture.
 
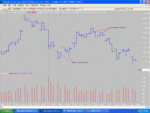
So do I read this correctly? Looking at the 30 min chart, I see every major low is met by lower volume. Is this telling me that sellers are getting less and less interested?
 

Attachments

  • ES Vol 02-06-04 30.gif
    ES Vol 02-06-04 30.gif
    27.4 KB · Views: 324
Hi china,

Thank you so much for the information. I have been looking for something like that for a long time. :D
 
CM - how I c it - pls orret me if i am wrong

U c that after the first bottom on high volume, u get 4 much lower volume readings - it does create "rare air" which bears shud not hesitate to burst in BEFORE LONG if they r to take it further down (bear flag).

however, their next attempt to do so produces second highest bar - and much higher than the 4 previous ones. SHORT COVERING in full speed, bears cannot even tank the price lower than the first dip.

Of coz smaller operators are allowed to try to bring the price down again (3rd highest volume bar) - just for the bigger ones who already covered their shorts to pick it up at lower prices :)
 
China White said:
Now look carefully at 2 price bars round 10:30, red one down, then a maribozu straight back up losing HIGHER than the previous bar ON THE SAME VOLUME LEVEL. What is that? only one thing - FULL SHORT COVERING.

China, help please. 10.28 is red. 10.30 black, not a maribozu, does not reach as high as 10.28 but greater volume, 10.32 black, slightly higher volume than 10.28, not a maribozu (I think, if a maribozu mean very short or no sticks) and reaches the same level as 10.28.

robq
 
ChartMan said:
So do I read this correctly? Looking at the 30 min chart, I see every major low is met by lower volume. Is this telling me that sellers are getting less and less interested?

It means three things at the same time, not one. I will come back when I am not busy and expand on this for you if you like. BTW, and what are all these little yellow stars all about, they keep increasing and decreasing. What is it all about ?
 
The stars are an indication of how members have rated your contributions. Broadly, all yellow indicates mostly positive ratings. ( 80 - 100% I think) etc. Initially, the ratings fluctuate quite a bit as the sample size is small, but then settle down as the sample size increases as one extra rating does not affect the 'banding'.
 
Great Stuff China,
I had already been thinking of Tick as a sort of volume indicator but not bright enough to work out how to use it :rolleyes:
It appears you have found the answer, thanks.
hampy
 
Your Chart ~ Your Question Answered.

ChartMan said:
The stars are an indication of how members have rated your contributions. Broadly, all yellow indicates mostly positive ratings. ( 80 - 100% I think) etc. Initially, the ratings fluctuate quite a bit as the sample size is small, but then settle down as the sample size increases as one extra rating does not affect the 'banding'.

Ah ! Thank you for the explanation. I understand. The fluctuation in stars is the consequence of having fired cannonballs at individuals who deserved them. We have now seen off the undesireables. Have you noticed how the tone of this thread has changed from one of empty bickering to one of happy, polite, serious discussion, which is as it should be. I am pleased with this development.

Now to your chart. What you see on it tells us three things, they are :~

The buying takes place on every low. There is very little selling on the highs.

The buying effort on bottoms diminishes as prices go higher ~ it takes less effort to push it up,
the herd is more and more contaminated with bullishness during the progression of the move.

There are more bulls than bears, meaning, there are less opportunities to go long as the availability of the instrument diminishes, as a consequence of gradual stock shortages, intermittently occuring.
 
SOCRATES said:
Ah ! Thank you for the explanation. I understand. The fluctuation in stars is the consequence of having fired cannonballs at individuals who deserved them. We have now seen off the undesireables. Have you noticed how the tone of this thread has changed from one of empty bickering to one of happy, polite, serious discussion, which is as it should be. I am pleased with this development..
:eek: :LOL:

What about an instrument that has no volume data such as E/$ perhaps using no indicators?
 
darktone said:
:eek: :LOL:

What about an instrument that has no volume data such as E/$ perhaps using no indicators?

Follow my posts, all in due course.
There is much work to be done before that .
But I will get to it.
 
News Release Strategy

Hi,

As you may have been aware, a lot of news is released after the market open, e.g. many types of economic news are habitually released at 9:45 or 10:00 am EST. Sometimes the news has a great impact on the market and changes the market direction, sometimes it goes without a trace.

So I wonder what is a proper strategy for news release? Assume there is some heavy-weight economic news to be released at 10:00 am EST in a particular day. The market opens and is already forming a trend at 9:40 am. Should I jump on the trend at that time, or should I wait for the news releases at 10:00 am?

Thanks indeed.
 
Last edited:
Hi Clylbw,

Tough call. For wot is worth, i play it safe and wait until the news comes out. My reasoning is that

1) You never know how the news will unfold
2) You never know wot the reaction might be due to varying opinions
3) Due to point 2, there is usually a swing of price in both directions, and by waiting you might be able to get in at a better price...then again you might not.

Others far more experienced than i will probably have different views??

Just a question if i may...when do people enter into a trade after tops.

I've marked, wot i see at least, as i 5 waves down the up.

Do you enter @

1) After the first reversal bar with stop at previous bar?
2) Wait for confirmation of the higher low/ lower high with stop just below/above this point?

I know 2 is a lot safer, but the reason i ask is you just don't know (well i don't anyway) how far point 2 is going to be from 1, and therefore could be missing out on some valuable points.


Thanks in advance
Fin
 

Attachments

  • untitled.GIF
    untitled.GIF
    227.1 KB · Views: 279
Hi Finirama,

Thanks indeed.

As for your question, I will stick my head out and make an attempt. :cheesy:

I would go long at the 15:20 pm bar with a stop below the 15:10 bar; same for the short one. So I guess it is (1) of your options.

I would enter at those points as to me they were both the end of the 5 waves, with a tweezer and a inverse tweezer bottoms marking the change of market direction. Moreover, if the patterns failed, as sometimes they do, I would normally know in time to make a small profit or break even at worst before changing direction to catch the continued trend. In the other hand, if I am right and the market does act as I thought, the rally could be a strong one, like the monster rally we saw the other day, and much would had gone before a pullback happens.

Sorry not very sophisticated :eek: . Maybe the experts would like to say something? :)
 
Top