You are using an out of date browser. It may not display this or other websites correctly.
You should upgrade or use an alternative browser.
You should upgrade or use an alternative browser.
'No indicators' revisited
- Thread starter ford
- Start date
- Watchers 53
china white
Established member
- Messages
- 979
- Likes
- 12
sorry lads/lasses - one more thing which I did not know about. My Quebecois mate saw my post here and told me this story:
Apparently there was a French speaking lad in Canada who at the grand banquet on the New Yr' Eve of 1900 publicly predicted that Paris will fall to enemies in the first half of the new 20th century. In 1918 Canadian papers dug that up and publicly ridiculed him, some on their front pages..... We all know what hap'd in 1940 don't we?
My point here again is that we listen to Socrates. Personally I am intrigued. If it is a hoax or a prank - we'll know soon, won't we? However, something is telling me it will be well worth listening to.
Just my opinion of coz 🙂
Bigbusiness
Experienced member
- Messages
- 1,408
- Likes
- 23
There were a lot of predictions about a nuclear incident last summer but nothing came of it. Does anyone remember Lord Jamla predicting disasters last year? He seems to have vanished now. Probably hiding in a cave somewhere expecting WW3 to start. I am not in to most of these predictions but I must admit that a 'Futorological Flash' does sound interesting.
china white
Established member
- Messages
- 979
- Likes
- 12
fini - that is actually not a compliment for a trader 🙂 as teachers of all sorts usually do not make it on the floor..... 🙁
on a serious note it always fascinated me how wars were won and lost "by a whisker" and that "whisker-away" stuff wud totally reshape the world.....
btw it has loads to do with trading imo.... why Mr X makes a good trader and Mr Y misses that league "by a whisker", gets dissapointed and leaves trading forever? Intelligence? discipline? fast fingers? bigger pockets finally? perhaps all of the above, but u'd perhaps agree that there is that elusive "whisker" in play which i cannot define in words....
anyway - apologies for my faffing 🙂 back to studying and trading!
F
ford
Dax May 24
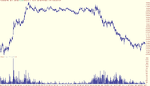
Lol, just as I was about to press "submit" to upload the 1 min chart I noticed that Ford just did the same, so I attach the 5 min chart in case some1 prefers it.
And as this is my first post to this great board I want to thank Skim, China, Ford, SandPiper, Sokrates and all other great posters here for making this the best board on web.
And to the flamers that seem to have arrived, go post on E**** T*****.
Thank you.
Bungle
Attachments
SOCRATES
Veteren member
- Messages
- 4,966
- Likes
- 136
DrBungle said:Lol, just as I was about to press "submit" to upload the 1 min chart I noticed that Ford just did the same, so I attach the 5 min chart in case some1 prefers it.
And as this is my first post to this great board I want to thank Skim, China, Ford, SandPiper, Sokrates and all other great posters here for making this the best board on web.
And to the flamers that seem to have arrived, go post on E**** T*****.
Thank you.
Bungle
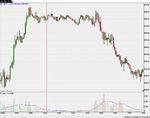
This is a very good chart. Observe that as soon as the fireworks predicted began to go off
the volume increases and stay hi all afternoon. Can you now let us have the one minute chart that you originally intended please. This will give all the doubters the opportunity of verifying
the post bar by bar price by price, minute by minute as posted. There's the challenge.
- Messages
- 2,325
- Likes
- 17
Dr Bungle - thank you, first of all. And perhaps you could post the 1 min bar chart with volume between 12:40 and 14:40 UK time, as that is the section during which Socrates' fireworks went off, according to his earlier post.
And thank you too, Ford. 😀
And thank you too, Ford. 😀
F
ford
My pleasure.. its the least I could do considering the massive collection of posts of yours on this forum that have helped me greatly.
Perhaps it might be best though if SOCRATES posted his own chart with annotations?
Perhaps it might be best though if SOCRATES posted his own chart with annotations?
China (et al)
Regarding your earlier point about that 'whisker of difference in people', a lot of people Ive spoken to in the past who have ran desks - both downstairs and upstairs, say that the reason they prefer the east end type (ex taxi drivers, builders etc) is their ability to dust themselves down after a few bad knocks. These are the types that persevere in their view. The worst are ex-professionals who need to control everything and walk around with attitude.
Not sure I'd agree that these backgrounds are the only types with perseverance, I expect they are only recalling their own beliefs. Nevertheless, I believe this quality makes the difference.
'A quitter never wins and a winner never quits' Taken from MC Hammer !!!!
Rognvald
Established member
- Messages
- 916
- Likes
- 15
I am offering some simple analysis on the one minute chart supplied for comment. It takes the form of lines of support and resistance, channels and linked volume.If you find it hard to see detail you can zoom in using the standard word toolbar and altering the size factor to suit your needs
Unfortunately using word means that precisionwith the lines is impossible
Unfortunately using word means that precisionwith the lines is impossible
Attachments
Last edited:
Bigbusiness
Experienced member
- Messages
- 1,408
- Likes
- 23
'A quitter never wins and a winner never quits' Taken from MC Hammer !!!!
That's weird. I was just listening to MC Hammer 'U can't touch this' from the C4 'The Hip Hop Years' CD. I haven't listened to it for years and suddenly got the urge tonight. Slightly off topic but I can blame that on the Holsten Pils 😆
That's weird. I was just listening to MC Hammer 'U can't touch this' from the C4 'The Hip Hop Years' CD. I haven't listened to it for years and suddenly got the urge tonight. Slightly off topic but I can blame that on the Holsten Pils 😆
SOCRATES
Veteren member
- Messages
- 4,966
- Likes
- 136
Finirama said:All this bickering is boring.
Socrates,
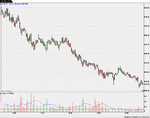
As mentioned in PM i do not use volume analysis for trading and simply use price bar patterns. I have been reviewing my trades with the addition of volume and can see that it gives a more complete picture, especialy regarding tight range trading days.
Just some questions if i may.
1) Do you use daily bars and volumes for trading direction expentancy for the following day?
2) Do you hold positions overnight in expectancy/future flash of a gap in the way of the trade? If so, wot determines whether a gap is likely on the following day or not?
I have posted a day chart for you reference.
First of all stop squabbling, don't prod China, I am not having any of this from any of you.
Any nonsense of any sort and I submerge. Not in your case, Finirama, because I can see it was good natured.
When I say submerge it is to demonstrate the difference between a rowing boat and a nuclear submarine.
Right, here we go, all of you pay close attention:~
First of all I am not interested in the instrument or what it is or is not.
It must qualify on three criteria.
1. It must be a liquid instrument.
2.There must be continuity of liquidity.
3. The price must move.(there are instruments that are very liquid out of proportion to their movement).
Now turn your attention to the chart. Look into it carefully. Don't look at it. Look into it.
Look at the second bar. It has a narrow spread, but the volume underneath it underpinning this result is huge. It is the greatest recorded volume in the whole chart, is it not ? Here lies the clue from which all subsequent market action develops.
Now observe that the third bar opens, lifts a little bit(which is a trap) and then collapses to close at or near the low. Why is this ?
Simple. If the previous bar (2) with all that huge volume underneath to underpin it were buying
the bar that follows it(3) would have rocketed north would it not ? Instead the bar that follows
does the OPPOSITE of what is expected (this is an information shock delivered to the herd),
which confuses the audience, and as if this were not enough of a shock to freak everybody (!)
the next bar opens and without so much as by your leave rockets upwards !................and then, when everybody(?) is getting really bullish and the media is trumpeting without shame and the commentators are commenting without any understanding of what it is they are commenting about, Plop ! Down it goes, to the dismay and astonishment of all, and to the fury of those who are long.Look carefully at the volume under (4) it is lower, is it not ? in fact isit not the lowest recorded volume on this chart so far ? It is isn't it . Why do you think that is? There are 2 reasons not one. First reason the residual instrument has been unloaded onto uninformed buyers who were influenced by the chattering they were listening to instead of paying attention to what they should have been paying attention to which is contained within the second reason.
What is it ? See the volume. This gives us another clue this type of volume is CAUSATIVE.
I am pretty sure that most of the business was done in the morning, and earlier part of the day.
But there is not the response that there should be to take this significantly higher. So, it collapses and closes just above the opening. This marginal advance in the price improvement for so much work to try to lift it on preceding days is not a success, is it, notwithstanding the trumpeting, eh ? What do you think of that ? Because now, the price begins to seeiously lose ground, and fast. YOU SEE HOW THE USE OF TIME HAS CHANGED. First the time was being stretched, with all this dithering going on, now everything is happening very fast, is it not ? Why and how is the time being manipulated ? Simple. There is a rush to buy back the instrument at considerably lower prices. What this level could be is known in advance and a target set to achieve the level within a given time period which in this case is not less than 10 and not more that 20 trading sessions (or days). This target is achieved on the 10th day. On the 9th day,
observe that the price action displays a drop to the lowest level so far and the volume is low. Why? If you understand all of this you would wait in the expectation of even lower prices, wouldn't you ? You would mount a dawn raid to do your buying then, when prices had been marked down at the open, and everybody is frightened this may go to the centre of the earth and come out the other side in the middle of Sydney Harbour or thereabouts,. But if you truly understand what is going on with the price with the volume and how the time is being used(here we are talking of net present time only) you will arrive at the conclusion that this is an excellent opportunity to buy the instrument cheaply, especially of your use of time is differerent to everybodyelse's. You see. You may be beginning to grasp that all this is a matter of priorities in which timing is the essence. This timing is always described as being in net present time.
That is a correct assumption insofar as acting on a flash of recognition is concerned , but what happens when an outcome is known in advance, the use of time becomes different. And this is what is happening here?Therefore everyone is baffled.What is happening should not be happening ~ but it is. Why ? This is the consequence of having two time values muddled up, rather like you checking your watch against the speaking clock. Your wristwatch will still keep time and display it, however you would not become aware of the error until you checked it.
Supposing you have no speaking clock to refer to. would your wrist watch time not be adequate for most practical purposes ? Supposing you did not use a wrist watch at all but everybody els was obliged to use one. Can you now see how the value of time is different, and because its value is different, so its use is different.. Imagine what havoc could be wreaked
with peoples' schedules and expectations if the use of time could be tampered with without anyone noticing. It would be very confusing would it not ?On the 14th bar the spread is narrow again, the volume is heavier than the previous bar, the price touches its lowest low and then snaps up smartly. But now look and you will see not as smartly as the next time this happens in bar (16) here the close is on the high, even closing above the opening. Market conditions are now changing. However prices drift, and are allowed to drift down to exactly the same price level as that achieved by the first fall after the gap down in bar (14) and yet the volume is higher, and now prices begin reluctantly to lift. Why is the volume higher in bar(20) than in bar (14) ? This is mixed volume ~ part is causative by the price being driven down and part is subjective as a cocsequence of the low price attracting buying = activity = volume.
Ok, we can see as we get nearer and nearer to the end of the chart how low price levels become more infrequent and last less.Why ? Because the use of time has been changed again from causative to subjective, as the bull phase takes hold. Everything that works in one timeframe works in another.Everything that happens in one timframe happens in another.
SOCRATES
Veteren member
- Messages
- 4,966
- Likes
- 136
Musn't bungle please.
Please refer to my earlier post on this thread # 709 ~ here you will see that the point
of interest occurs at 1245 . Therefore a 1 min from that time would be really helpful, instead of
as from later as the current chart displays. Thanks.
DrBungle said:Little confusion in the times, but I think this one covers the period Socrates was commenting.
Bungle
Please refer to my earlier post on this thread # 709 ~ here you will see that the point
of interest occurs at 1245 . Therefore a 1 min from that time would be really helpful, instead of
as from later as the current chart displays. Thanks.
SOCRATES
Veteren member
- Messages
- 4,966
- Likes
- 136
You cannot imagine how much fun this is for me and how interesing it really is.
I am sitting in here surrounded by all these whirring monsters that have been defragged, etc.,
and I am disappointed that the court jester has not appeared so far.
The time now is 0118 precisely, and I am off to bed after al long day
I am sitting in here surrounded by all these whirring monsters that have been defragged, etc.,
and I am disappointed that the court jester has not appeared so far.
The time now is 0118 precisely, and I am off to bed after al long day
Similar threads
- Replies
- 1
- Views
- 5K
- Replies
- 0
- Views
- 2K
- Replies
- 412
- Views
- 97K