TheRumpledOne
Senior member
- Messages
- 2,166
- Likes
- 78

RESULTS


Mr Rumpled One Instead of posting charts of what may happen why dont you post a statement of what actually did happen

I could make a mistake, ain't here to start a war. I just never found the real meaning of all those indic.
And since explanation are always cutted in half...
In fact, you just made the best resume of this idea in a short sentence whit no funny trics around, thx!
If this work for you I'm happy!

This is no result.... this is after fact affirmation, witch is the easiest way to play whit newbs.
You know it!
If you can't describe the reason why you enter, hold, and exit, all those colored indicators worth a big minus 5.
I respect your work, but whit time I found that this is pure joke. You act like you know something, but you can't "put it all together". In short, your post are only missleading more then anything.
Have I red before that you think indicators are worthless, but again you push them on anyforum for donation... You even know how newbs like to load their chart whit funny indic, and you are the one providing them... acting like a guru.
The guru of indicators?!?....
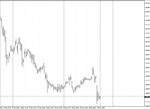
ps: i'm leaving a chart for you, do you see the pattern?!?!? LOL

I guess you didn't read this:
I have explained the GREEN RAT REVERSAL before but I'll do it again:
1) price within 20 pips of the daily low - that is OPPORTUNITY
2) red candle closes
3) green candle closes - note the high price of the green candle.
4) enter long at the green candle's high price
5) STOP LOSS IS 10 PIPS
6) Take whatever profit you can.
You do NOT need indicators to do this.