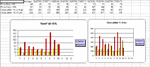
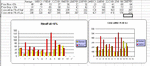
Here is my market breadth analysis for the last 2 weeks. Notice the trend? I plot the number of closes within 1% of the day's high against the number of closes within 1% of the day's low on one graph. On the other graph I plot the number of stocks that have risen by more than 5% against those that have fallen by more than 5%.
You can see that the falling stocks have significantly declined and the rising stock have formed a bottom and are now gaining.Should be in for a good week next week...
You can see that the falling stocks have significantly declined and the rising stock have formed a bottom and are now gaining.Should be in for a good week next week...