Moving Average Crossing with MACD Strategy

psb67

Newbie
Messages
8
Likes
1
Hello friends,

Wish to convey a highly Healthy And Wealthy 2011 to everyone.

Although Moving Average Crossing is quite popular and many experts in this respectable forum have shared their strategies and their experiences, I wanted to share with you the MA-X strategy with MACD that I use in my analysis for EURUSD (6E).

I use Ninjatrader and the images are from the same.

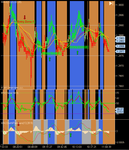
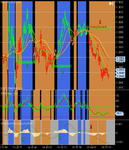
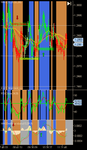
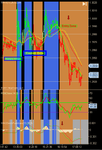
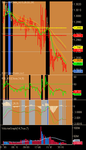
The strategy is purely manual or discretionary. I prefer visual effects with background and bar colors, so the indicators are tuned to perform the same. The indicators are usual ones, I have only made some changes in the code to display background color when the crossings occur.

I use 4 MAs - 13(Green),26(Orange),39(Yellow) & 52(Red) & MACD-13,39,9 and 63 Sec. time frame. I regularly check with higher time frame for the direction.

The entry strategies:

Buy when Green crosses Orange, Yellow and Red from below and at the same time MACD crosses above Zero line.

Sell when Green crosses Orange, Yellow and Red from above and the same time MACD crosses below Zero line.

My usual target is 10 pips per trade.

The charts are taken from 7th instant for this discussion purpose.

Healthy And Wealthy Trading
 

Attachments

  • EU_EZ_070111.png
    EU_EZ_070111.png
    77.6 KB · Views: 798
  • EU_EZ1_070111.png
    EU_EZ1_070111.png
    85.1 KB · Views: 711
It should be easy to backtest this startegy to find out whether it is promising.
 
It should be easy to backtest this startegy to find out whether it is promising.

First of all, the strategy that I use is a discretionary one. I don't know whether there is something called "Promising" so far as any strategy is concerned. To me a strategy is like a light house, helps me get a direction; my strategy does not decide my trades, I decide when there is Trade Zone and when there is not. :)

Except the back & bar colors that I have added to help me get visual effects, there is nothing unique about the indicators. They are normal MA indicators, added in one MA indicator and the MACD is the usual one. The background and bar colors change when the crossings occur.

Healthy And Wealthy Trading
 
Last edited:
I like the looks of that chart and system, practice will allow you to make some nice profits.

You might consider having the higher time frame chart on the screen at the same time, perhaps even two higher time frame charts, ie 126 sec and 189 sec....

Looks good.!!
 
I like the looks of that chart and system, practice will allow you to make some nice profits.

You might consider having the higher time frame chart on the screen at the same time, perhaps even two higher time frame charts, ie 126 sec and 189 sec....

Looks good.!!

Yes, you are right. In fact I wanted to add 123 sec. and 15 min. charts that I use but later decided not to crowd too many charts. I will certainly add them next time.

<<like the looks of that chart and system, practice will allow you to make some nice profits.>> Yes it does. MAs, RSI and MACD offer extra ordinary insights about the price movement but it takes considerable time to understand the nuances of these great indicators.

Healthy And Wealthy Trading
 
Last edited:
You may want to make a lot of written notes and also mark up some charts with your observations and keep those.

Preparing written rules for entries and exits and marking charts is a great way to drive stuff home.

My own experience has been to want to bend the rules and then have a disaster.
 
You may want to make a lot of written notes and also mark up some charts with your observations and keep those.

Preparing written rules for entries and exits and marking charts is a great way to drive stuff home.

My own experience has been to want to bend the rules and then have a disaster.

<<Preparing written rules for entries and exits and marking charts is a great way to drive stuff home.>> I 100% agree with you. Besides, at any given point of time I follow only one instrument that always helps me immensely.

<<My own experience has been to want to bend the rules and then have a disaster.>>
Well, bending the rule is acceptable but only breaking them ends up with great disaster. :)

Healthy And Wealthy Trading
 
I like the looks of that chart and system, practice will allow you to make some nice profits.

You might consider having the higher time frame chart on the screen at the same time, perhaps even two higher time frame charts, ie 126 sec and 189 sec....

Looks good.!!

While thanking you for your response, I am herewith attaching 123 sec. and 15 min. charts of 7th instant for your understanding.

The meaning of Caution Zones that I have mentioned in the chart is, even though 63 sec. gives trading opportunities, 123 sec. does not conform to the same; it says be cautious with your trades, do not stretch your positions. What I am specifically looking for is, at what stage the crossings happen, in other words the distance between MAs makes all the difference. This is the beauty of MA crossing that immensely helps in identifying No Trade Zones and Caution Zones.

Also, 15 min. is clearly on the downtrend which further prompts to be cautious on the Long trades.
 

Attachments

  • EU_123Sec_070111.png
    EU_123Sec_070111.png
    58 KB · Views: 522
  • EU_123Sec1_070111.png
    EU_123Sec1_070111.png
    63.3 KB · Views: 593
  • EU_15Min_070111.png
    EU_15Min_070111.png
    45.4 KB · Views: 468
I'm not sure how to set the time frames from Metatrader, but I think I got it. From what I can see at least from the setup you described sans the timeframe, that this works when expecting a major swing, but ineffective for short ones.
 
I'm not sure how to set the time frames from Metatrader, but I think I got it. From what I can see at least from the setup you described sans the timeframe, that this works when expecting a major swing, but ineffective for short ones.

In MT4, we have only 1M, 5M and etc. time frames. It does not matter a much so long as the concept is understood and applied. If you take a look at today's EURUSD-1M & 5M, you can clearly see the difference.

Yes, you are right, it works nicely with the trend but not with sideways.
 
Few systems work well without a trend and we are often looking at charts that have no great trend...... a frustration indeed.
 
Top