isatrader
Senior member
- Messages
- 2,965
- Likes
- 136
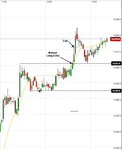
Trade 25
Date: 27/9/12
DOW 30
Signal Bar High (12:00 to 13:00 ET): 13501.6
Entry: 13501.5
Exit: 13511.7
Profit/Loss: 10.2
Highest high: 13523.8
Lowest low: 13499.8
Max above buy stop: 22.1
Max below buy stop: -1.9
Entry Bar Time (US): 13.36
Exit Bar Time (US): 13.39
Total Trade length: 3 mins
Entry Slippage: +0.2 (Manual Entry)
A win for the method today after a nice rebound off the lows, consolidation and a continuation move - which was the trade. As the 10 pt target has been so successful in the first 2 months of live testing I decided to switch to that for my actual trades from now on. But I'm still going to keep jotting down the data for the 15 pt as well, as it's still doing well and would have been successful today, and will probably outperform in the long term, but I like the lower volatility of the 10 pt target.
Below is the charts