You are using an out of date browser. It may not display this or other websites correctly.
You should upgrade or use an alternative browser.
You should upgrade or use an alternative browser.
wallstreet1928
Legendary member
- Messages
- 6,609
- Likes
- 89
you might find this interesting..........
help you with good shorting entry levels...
http://www.livecharts.co.uk/pivot_points/pivot_points.php?symbol=^FTSE
help you with good shorting entry levels...
http://www.livecharts.co.uk/pivot_points/pivot_points.php?symbol=^FTSE
minime69
Established member
- Messages
- 754
- Likes
- 25
you might find this interesting..........
help you with good shorting entry levels...
http://www.livecharts.co.uk/pivot_points/pivot_points.php?symbol=^FTSE
i like it, but only for cash they dont have one for FTSE futs
I haven't written anything on the 100 since 12/12. I can't provide the entire article but here are a few extracts.
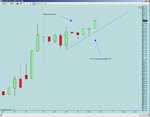
The chart below shows the labels for each leg of the double bottom. Under common rules a DB is not deemed to be valid unless the FTSE can close above the November high. However as with any double bottom, there is far more involved than simply taking a long position should that signal occur.
One strategy that can assist on the double bottom formation is to use basic FSS rules. The green lines represent a Fibonacci fan plotted from the July 07 high to the October low. In an ideal scenario, if a double bottom is confirmed the breakout signal would occur after the primary line of the fan has dropped below or equal to the November high value. This would result in two signals being generated simultaneously which often leads to greater momentum. On the other hand when a breakout occurs with the primary line just above the B high, the fan frequently acts as resistance forcing those that have acted on the double bottom alone to stop out of their positions.
As the break zone of the FSS level is now below the break zone or confirmation level of the double bottom, we now have a stronger or reinforced double bottom formation. We then work the basic chart as described below. Draw our three standard extension levels of 161.8, 200 and 261.8% extensions of the B - C leg. We will now need to include one more extension being the 123.6%. It’s important to keep in mind that this level is not a target zone but a failure zone.
When we have a chart resembling the one below, the target of the 200% at just a touch over 5600 will become the most probable target area. Work needs to be done though. Basically there are two scenarios which have the highest probability. The double bottom remains valid and continues to the upper price range, in which case this leg will then be labelled as D. The other scenario is a complete failure, if the FTSE fails to break the 123.6 after confirming the Double Bottom, this suggests a test of the current lows, or at least a test of the 50% level of the B - C leg. A failure to break the 123.6 extension would require the current leg to be labelled as X. The scenario then will require the following two legs to be labelled as Y and Z. For the Elliott fans among you, before you start jumping up and down, this is a Fibonacci labelling system, not an Elliott system.
So until we see signs of failure, the presumption is that this particular structure will complete in an orderly fashion. So excluding the 123.6 level, and assuming a confirmation of the double bottom, we would then focus on the secondary (50%) level of the Fan which currently has a value around 4900, in addition we would focus on the three extensions of the 161.8, 200 and 261.8, so four areas of target significance. Now as always, the standard rule of bigger is stronger also applies. The three red lines pictured are from a larger degree fan and should not be forgotten as the larger degree remains valid until such time as the FTSE breaches the 2003 low. However with the strength and time relationship of this particular structure, the 50% FSS and 161.8 extension levels are expected to be hit.
So some studies are to explore the above charts, as a trader try and assess how you would manage each level, what signs you would look for as each level is attacked and what clues as to continuation or failure you can see. This chart has a great deal of significance so I’ll continue to come back to it as things progress.
Have a great week.
Dentalfloss
Legendary member
- Messages
- 63,404
- Likes
- 3,726
out at 4638
what prompted this fall.?
what prompted this fall.?
minime69
Established member
- Messages
- 754
- Likes
- 25
out at 4638
what prompted this fall.?
not sure but.. there is a big seller @ 4616 in the future and seem to be a lot of buying in front of him but could not push through, plus lunch time and poss bit of profit taking and stopping out.
KillPhil08
Experienced member
- Messages
- 1,860
- Likes
- 381
Breakout of trend, this is too simple guys. (not sure why but i had 4650 as a good resistance).
KillPhil08
Experienced member
- Messages
- 1,860
- Likes
- 381
Anyone fishing for tops to fade? I might try 4648 again.
tripleogstar
Established member
- Messages
- 659
- Likes
- 29
Surely the FTSE has to tank tomorrow, there is too much undeserved strength in the market
tripleogstar
Established member
- Messages
- 659
- Likes
- 29
Resistance is at 4700, the high set on 4th November 2008. 4700 is also the 50% Fibonacci line if you draw it from 19th may 2008 (Just before the sell off) and the low set on 27th October 2008.
Surely the FTSE has to tank tomorrow, there is too much undeserved strength in the market
I was just coming here to go "What the blazes is with the market". The news is full of Woolworths closing on one side, Whittards on the other and Zavvi in the middle, and the FTSE 100 just marches cheerily upwards like it's on Prozac.
I was just coming here to go "What the blazes is with the market". The news is full of Woolworths closing on one side, Whittards on the other and Zavvi in the middle, and the FTSE 100 just marches cheerily upwards like it's on Prozac.
Rumour has it the Bank of England's going to make interest rates negative at the next meeting.
Rumour has it the Bank of England's going to make interest rates negative at the next meeting.
So... everyone with money pays it directly to people with debt. Y'know, I can actually almost seem them doing that...
tripleogstar
Established member
- Messages
- 659
- Likes
- 29
Rumour has it the Bank of England's going to make interest rates negative at the next meeting.
I think it is ridiculous, there is no way they will do that. If that was the case, you would see gilts rallying, but they are tanking today
Dentalfloss
Legendary member
- Messages
- 63,404
- Likes
- 3,726
the nas 100 iis about to breakout relative to the dow.seems like there is a renewed apettite for risk in the market
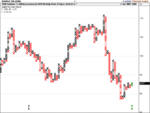
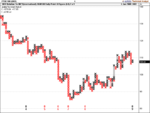
chart is the nas100 relative to the dow starting from 8 jan 08.the relative strength is normalised ie percentage.this is what we have been waiting for,markets just recovering from being very oversold.we wait for a confirmed breakout.the relative trendof the na to the dow is upwards
chart is the nas100 relative to the dow starting from 8 jan 08.the relative strength is normalised ie percentage.this is what we have been waiting for,markets just recovering from being very oversold.we wait for a confirmed breakout.the relative trendof the na to the dow is upwards
Attachments
Dentalfloss
Legendary member
- Messages
- 63,404
- Likes
- 3,726
Dentalfloss
Legendary member
- Messages
- 63,404
- Likes
- 3,726
Similar threads
- Locked
- Replies
- 19K
- Views
- 2M
- Replies
- 9
- Views
- 3K