Chris_Shaw
Active member
- Messages
- 121
- Likes
- 1
10/01/15 Recap and prep (for 10/2).
This may be a short recap, I only traded the am session and am leaving for the boat races at Lake Havasu, AZ right about after I post today and will be gone the weekend. So no reports until hopefully Sunday.
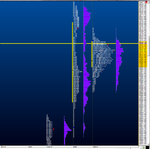
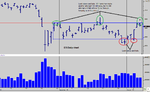
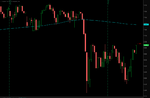
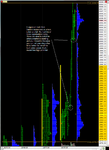
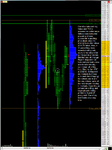
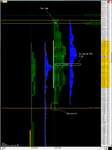
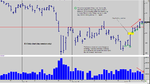
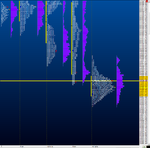
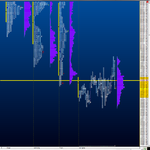
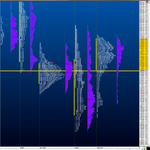
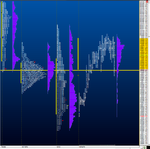
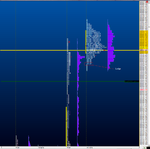
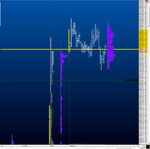
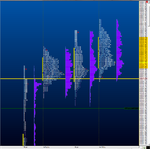
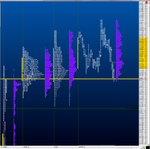
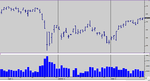
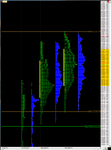
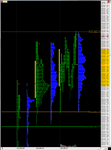
The most important thing I want to highlight today is a perfect trade. These Market Profile concepts was the reason I was able to anticipate and expect this set up. After the early morning high the mkt came back down to the open, through it and continued all the way to yesterday's prominent POC - in B period. I also had indications of exhaustion selling around this price area on my indicators. Once C period opened, there was a good rally off the early lows (some 11 handles. 9 of which could've been had with very good trade location and risk with an exit right under yesterdays pit high). I am not conditioned to hold trades that long. However, I got a good piece of the whole swing of things, 2 pts towards the POC. And 4 pts in 2 separate trades on the way up. My day was done.
The reason as always when I highlight specific's that I post is to point out that these concepts are reliable and they work. Hopefully they spark interest in someone to study Market Profile as J Dalton teaches it. It's worth the effort, especially in the emotional capital department.
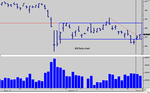
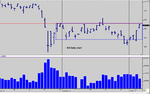
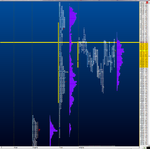
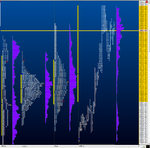
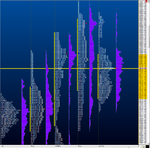
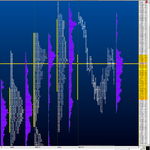
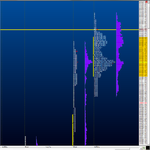
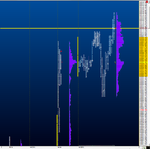
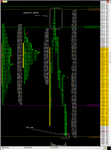
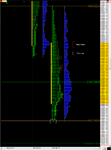
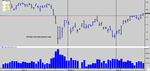
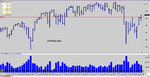
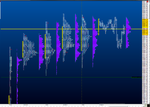
Today's profile:
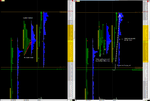
1) We are now 1T.F. higher on a daily basis for two days now.
2) We are above the down trendline on a daily chart. There is decent excess lows (put another way, secure lows) on today and yesterday.
3) Value is higher along w price. This is positive for upside continuation.
4) We have a poor high, and a TPO POC that has remained exactly in the center of the profile. This may be negative short term for upside continuation. Because, the poor high is evidence that traders got themselves too long, and the POC being center is evidence that this level 1903.75 was the fairest price today.
Good luck in your trading.
This may be a short recap, I only traded the am session and am leaving for the boat races at Lake Havasu, AZ right about after I post today and will be gone the weekend. So no reports until hopefully Sunday.
The most important thing I want to highlight today is a perfect trade. These Market Profile concepts was the reason I was able to anticipate and expect this set up. After the early morning high the mkt came back down to the open, through it and continued all the way to yesterday's prominent POC - in B period. I also had indications of exhaustion selling around this price area on my indicators. Once C period opened, there was a good rally off the early lows (some 11 handles. 9 of which could've been had with very good trade location and risk with an exit right under yesterdays pit high). I am not conditioned to hold trades that long. However, I got a good piece of the whole swing of things, 2 pts towards the POC. And 4 pts in 2 separate trades on the way up. My day was done.
The reason as always when I highlight specific's that I post is to point out that these concepts are reliable and they work. Hopefully they spark interest in someone to study Market Profile as J Dalton teaches it. It's worth the effort, especially in the emotional capital department.
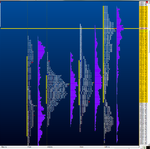
Today's profile:
1) We are now 1T.F. higher on a daily basis for two days now.
2) We are above the down trendline on a daily chart. There is decent excess lows (put another way, secure lows) on today and yesterday.
3) Value is higher along w price. This is positive for upside continuation.
4) We have a poor high, and a TPO POC that has remained exactly in the center of the profile. This may be negative short term for upside continuation. Because, the poor high is evidence that traders got themselves too long, and the POC being center is evidence that this level 1903.75 was the fairest price today.
Good luck in your trading.