Hi,
I've been reading up on Volume Profile, I've read the CBOT Handbook and I'm slowly making my way through Mind Over Markets, however I'm a little confused about the TPO count.
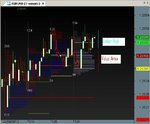
I'm trying to make broad generalisations here based on the count to include in my study of the Profile. If I understand correctly, seller count is on top and buyer count is on the bottom. So, when the top number is higher, there are more sellers in the market (so prices should start moving down) and when the bottom number is higher there are more buyer (prices should start moving up).
I've attached a screenshot of the EURUSD I've been looking at today. In this situation, is it correct to assume that "Responsive Selling" should start taking place? If the numbers were inverted (i.e. 134 on the bottom, 94 on the top), then "Initiative Buying" would taking place and I should anticipate a rise in prices?
Reason I ask is that sometimes I take a look at the TPO count, it implies more sellers, for example, are in the market, but prices just race higher. And vice versa. It's kind of disorienting when looking to confirm a trade - I wouldn't want to enter long when there are more sellers in the market, for instance. Or am I missing something or using the count wrong? :?:
I know in the handbook, the author states TPO counts are less important in the 24 hour market of today but surely there must still be a way to put them to good use.
Thanks.
Seth
I've been reading up on Volume Profile, I've read the CBOT Handbook and I'm slowly making my way through Mind Over Markets, however I'm a little confused about the TPO count.
I'm trying to make broad generalisations here based on the count to include in my study of the Profile. If I understand correctly, seller count is on top and buyer count is on the bottom. So, when the top number is higher, there are more sellers in the market (so prices should start moving down) and when the bottom number is higher there are more buyer (prices should start moving up).
I've attached a screenshot of the EURUSD I've been looking at today. In this situation, is it correct to assume that "Responsive Selling" should start taking place? If the numbers were inverted (i.e. 134 on the bottom, 94 on the top), then "Initiative Buying" would taking place and I should anticipate a rise in prices?
Reason I ask is that sometimes I take a look at the TPO count, it implies more sellers, for example, are in the market, but prices just race higher. And vice versa. It's kind of disorienting when looking to confirm a trade - I wouldn't want to enter long when there are more sellers in the market, for instance. Or am I missing something or using the count wrong? :?:
I know in the handbook, the author states TPO counts are less important in the 24 hour market of today but surely there must still be a way to put them to good use.
Thanks.
Seth